Both Gold and the Dow has in recent times made significant bull market signals.
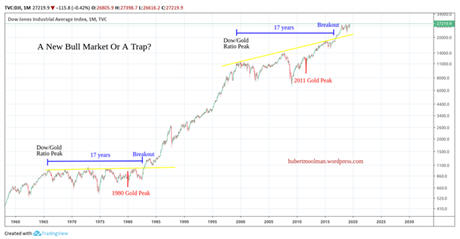
The Dow in 2016 when it broke out of a rising resistance line:

The breakout was 17 years after the Dow/Gold Ratio peak, just like it did in 1982. Also, the breakout came a few years after a significant Gold peak, again just like the 70s/80s pattern depicted in the chart above.
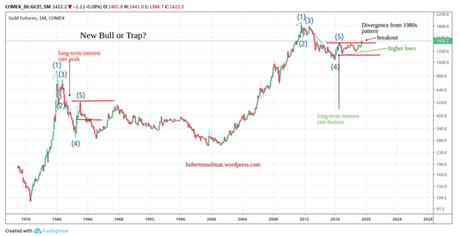
Gold on the other hand signaled a new bull market this year when it crossed a key level:

Since 2011 it has been forming a similar pattern to one of the early 80s. However, it signaled a new bull market when it diverged from the 80s (bear pattern) by breaking higher than point 5.
There is a problem however. One of them appears to be “lying.” There is no way that both of these can be starting a new bull market. Yes, they might be able to run up together for a while, but at some point there will be major divergence.
I have written about why this is the case, on numerous occasions (
recently here).
I guess we will find out soon enough who is lying? A simple but diligent application of the buy low sell high principle could probably help making this decision.
Since the question is (put in another way): who is starting a new bull market? Is it the Dow that is trading at more than 27 times its last significant high (1973 high: about $1000), or is it gold that is trading at less than its 2011 high and trading at less than double of its 1980 high (around $850)?
For more of this kind of analysis, you are welcome to subscribe to my
premium service. I have also recently completed a
Silver Fractal Analysis Report as well as a
Gold Fractal Analysis Report.