So it happened – oil reversed lower and we were right there. While yesterday’s downswing has been partially retraced, and oil is trading close to unchanged today, there’re still plenty of valuable clues as to the upcoming price action. Let’s dive in to see how they reflect on our yesterday’s profitable decision.
We’ll take a closer look at the charts below (charts courtesy of
https://stockcharts.com and
www.stooq.com ).

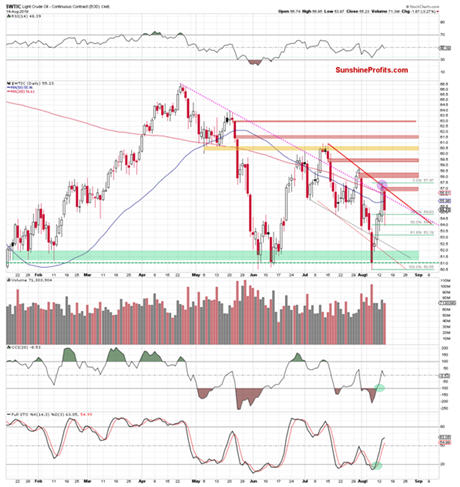
Tuesday’s invalidation of the tiny breakout above the declining red resistance line hinted at buyers’ weakness, preceding Wednesday’s slide. That day, crude oil opened with the red gap – while the bulls partially closed it, they hadn’t been fully successful.
The bears took the reins since, and oil has tested the 50%
Fibonacci retracement. This support triggered a rebound and the commodity erased some of earlier losses, but still closed the day below the pink dotted resistance line. This is similar to the price action we have seen two times in the past: on July 16 and then on August 1. In both cases, such development translated into further deterioration in the following days.
Let’s not forget that oil has moved below the 50-day
moving average. In fairness though, the
volume of yesterday’s downswing could have been bigger – that would lend it even more weight.
Let’s check today’s action in the oil futures for more clues.

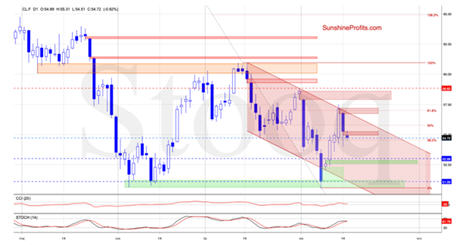
Let’s quote from our yesterday’s commentary:
(…) the 61.8% Fibonacci retracement in combination with the upper border of the channel encouraged the sellers to act, resulting in a pullback before the day's close.
As a result, the futures finished Tuesday back inside the channel, invalidating the earlier tiny breakout. This sign of weakness encouraged the bears to act earlier today, resulting in a daily opening with the red gap. (…)
We have seen a similar price action on August 1 already - and it translated into a sharp move to the downside. Taking this fact into account and combining it with the above-mentioned resistances, opening short positions is justified from the risk/reward perspective. (…)
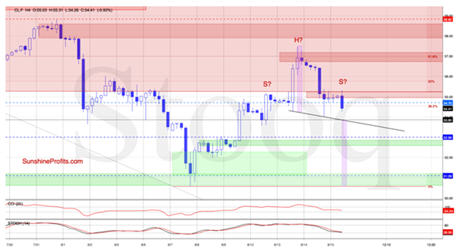
The daily chart shows that crude oil futures extended loses after the Alert was posted, which resulted in a drop to our initial downside target. Although the futures rebounded before yesterday’s closing bell, they opened today with another red gap, which doesn’t bode well for the bulls – especially when we factor in the 4-hour chart below.
 Summing up
, oil went on a powerful downswing yesterday, piercing through important supports. While it happened on significant volume, a higher reading would give it more credence. Earlier today, the bears opened with another gap lending further support to the sellers. Additionally on the 4-hour chart, we see a potential head-and-shoulders formation in the making – once completed, that would represent another bearish factor. The profitable short position remains justified.
If you enjoyed the above analysis and would like to receive daily premium follow-ups, we encourage you to sign up for our Oil Trading Alerts in order to also benefit from the trading action we describe. Check more of our free articles on our website, including this one: it covers what exactly the analysis of the 4-hour chart is telling us (hint: it’s about the downside target) – just drop by and have a look. We encourage you to sign up for our daily newsletter, too - it's free and if you don't like it, you can unsubscribe with just 2 clicks. If you sign up today, you'll also get 7 days of free access to our premium daily Gold & Silver Trading Alerts. On top, you’ll also get 7 days of instant email notifications the moment a new Signal is posted, bringing our Day Trading Signals at your fingertips.
Sign up for the free newsletter today!
Thank you.
Nadia Simmons
Forex & Oil Trading Strategist
Sunshine Profits - Tools for Effective Gold & Silver Investments
* * * * *
All essays, research and information found above represent analyses and opinions of Przemyslaw Radomski, CFA and Sunshine Profits' associates only. As such, it may prove wrong and be a subject to change without notice. Opinions and analyses were based on data available to authors of respective essays at the time of writing. Although the information provided above is based on careful research and sources that are believed to be accurate, Przemyslaw Radomski, CFA and his associates do not guarantee the accuracy or thoroughness of the data or information reported. The opinions published above are neither an offer nor a recommendation to purchase or sell any securities. Mr. Radomski is not a Registered Securities Advisor. By reading Przemyslaw Radomski's, CFA reports you fully agree that he will not be held responsible or liable for any decisions you make regarding any information provided in these reports. Investing, trading and speculation in any financial markets may involve high risk of loss. Przemyslaw Radomski, CFA, Sunshine Profits' employees and affiliates as well as members of their families may have a short or long position in any securities, including those mentioned in any of the reports or essays, and may make additional purchases and/or sales of those securities without notice.