Silver is now ready to follow gold and successfully signal its bull market. In fact, it is important that silver do so, in order to provide another confirmation that gold’s recent rally is “real”.
The following technique (as presented
previously) could provide a way to track silver until it provides that clear bull market signal.
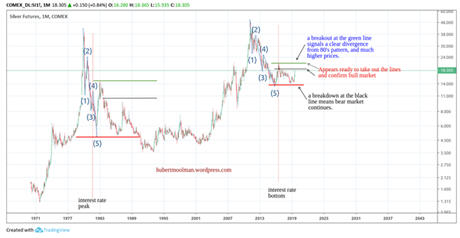
Below, is a long-term silver chart:

On the chart, I have marked two patterns 1 to 5, to show how the current period is similar to the period circa 1983.
If the comparison to the 1980s pattern is justified, and the current pattern continues in a similar fashion, by breaking down at the red line, then silver will continue in a long bear market. If the current fractal diverge from the 80s fractal by breaking out at the green line, then the bull market will resume with vigor.
Silver has now made significant moves over the last couple of months, and appears ready to confirm the bull market.
Once it breaks through the above key levels, it would confirm that it follows this pattern, below:

It still has a lot of work to do, but this is likely to happen quickly now. The stock market is still near all-time highs, and is looking very vulnerable to a massive collapse. This will provide the acceleration that silver needs to move even faster.
For more on this and this kind of fractal analysis, you are welcome to subscribe to my
premium service.
I have also recently completed a
Silver Fractal Analysis Report as well as a
Gold Fractal Analysis Report.