RARE AND RAPID DROP IN ISM MANUFACTURING
ISM Manufacturing PMI Index came in well below expectations on October 1, 2019 sparking renewed fear of a recession.
.jpg)
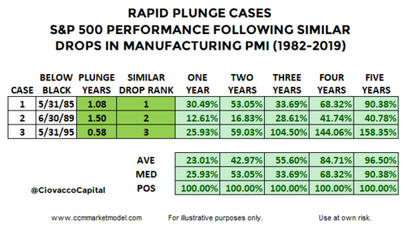
Given the ISM Manufacturing Index was strong in August 2018 and plunged rapidly to the October 1, 2019 level, it might be helpful to know how many similar drops from above the blue line to below the black line have occurred since 1982 and how did the stock market perform over the next five years? The answer to the first question is five previous times (see chart below).
.jpg)
The answer to the question how did the stock market perform over the next five years is “quite well”. In the first two years, 80% of the cases posted positive returns. All historical cases (1982-2019) posted gains after four and five years.
.jpg)
In the present day case, it took 1.08 years for ISM Manufacturing PMI to drop from the peak above the blue line to below the black line. As you can see in the table above, the three most similar “rapid drops in ISM Manufacturing PMI” cases were 1985, 1989, and 1995. The 2008 and 2016 cases required over four years to see a similar drop to what just occurred in a little over a year. If we isolate the similar “rapid plunge” cases, historical performance was more satisfying.
The present day case has many unique circumstances and will follow a unique path. This study simply provides some additional historical context. The bearish case for a rapid plunge in manufacturing data is easy to understand and will get plenty of coverage. These studies, based on history, tell us to keep an open mind about all outcomes from wildly bearish to wildly bullish.
EXPANDED COVERAGE IN THIS WEEK’S VIDEO
This week’s CCM video will most likely provide additional context regarding the similar historical periods shown above. CCM’s weekly video is released every Friday evening between 6 pm ET and midnight. Weekly videos can be found via
CCM’s Twitter Feed,
CCM’s Blog Short Takes, or the
Ciovacco Capital Channel.
BUT 2019 IS SIGNIFICANTLY DIFFERENT
You can make that argument about 100% of the historical studies performed about the economy and financial markets. No two periods in human and market history have the exact same combination of fundamentals, technicals, valuations, interest rates, inflation, etc. Today is always different; that is a constant in the markets.
WHAT ABOUT SMALL SAMPLE SIZES?
The limited sample size of the similar cases above is what it is. We cannot control sample sizes. There have only been three 40%-plus declines in the S&P 500 since 1950 (1973-74, 2000-2002, and 2007-2009), which also represents a very small sample size. Are we supposed to totally ignore these major declines because of the small sample size? According to Reuters, the S&P 500 was officially launched on March 4, 1957, meaning any S&P 500 study deals with a very limited historical data set. It is what it is.
When we study rare events, we acknowledge the sample size and try to learn anything that can add value in the present day. The same concepts apply to the studies above. There are countless economic and market studies that are based on small sample sizes.
Typically, the small sample size argument is only raised when the results run counter to someone’s personal opinion. When results agree with someone’s personal view, the small sample size is suddenly not a problem. If you believe a study or data set is irrelevant, there is an easy solution - ignore it.
This post is written for clients of Ciovacco Capital Management and describes our approach in generic terms. It is provided to assist clients with basic concepts, rather than specific strategies or levels. The same
terms of use disclaimers used in our weekly videos apply to all Short Takes posts and tweets on the CCM Twitter Feed, including the text and images above.
Important Disclosures: While the CCM Market Model is based on sound economic and investment principles, there is no guarantee any of the objectives will be met in the future. The terms odds and probabilities also speak to uncertain outcomes. Risks are covered in more detail in the CCM Client Agreement and LPOA. The performance information presented in certain charts or tables represent backtested performance from December 31, 2002 to December 31, 2017, using the model to select ETFs and adjust portfolio allocations based on market conditions. Backtested performance is hypothetical (it does not reflect trading in actual accounts) and is provided for informational purposes only to indicate historical performance had the model portfolios been available over the relevant period. Front-end screens were added to the model in May 2017, and subsequently backtested in the second half of 2017. Backtested performance does not represent actual performance and should not be interpreted as an indication of such performance. Backtested performance results have inherent limitations, some of which are described herein. Backtested returns do not represent the performance results of actual trading and are calculated through the retroactive application of the advisor's model portfolio configuration, designed with the benefit of hindsight. Since backtested performance results do not represent actual trading, they may not reflect the impact that material economic and market factors might have had on the decision-making of the advisor, if the advisor was managing the client assets. No representation is being made that the advisor's strategy will or is likely to achieve profits or losses like those shown. In fact, there are frequently significant material differences between backtested performance results and performance results subsequently achieved by following a strategy. In addition, backtested performance does not involve financial risk, and no hypothetical trading record can completely account for the impact of financial risk in actual trading. For example, the ability to withstand losses or adhere to a trading program in spite of trading losses are material points which can also adversely affect actual trading results. There are numerous other factors related to the markets in general or to the implementation of any specific trading program which cannot be fully accounted for in the preparation of backtested performance results and all of which can adversely affect actual trading results. The backtested performance results shown reflect the deduction of: (i) an average annual asset management fee of 0.87%; and (ii) estimated transaction fees and other expenses that a client would experience. The results portrayed reflect the reinvestment of dividends, interest and other income, as appropriate. Backtested performance results assume weekly rebalancing at the end of each week. It is important to understand the assumption of weekly rebalancing has an impact on the annual and weekly returns shown. For weekly rebalancing, the weekly return is calculated with the assumption that the portfolio is perfectly in balance at the beginning of each week. In actual portfolios, however, rebalancing occurs at no set time, and such actions are dependent on both market conditions and individual client liquidity inflows and outflows, along with the cost impact of such transactions on the overall portfolio. As with any investment strategy, there is potential for profit as well as the possibility of loss. CCM does not guarantee any minimum level of investment performance or the success of any client account, model portfolio, or investment strategy. All investments involve risk and investment recommendations will not always be profitable. Past performance does not guarantee future results. Backtested results do not guarantee future results. Results are compared to the performance of the S&P 500 Index ETF (SPY) for informational purposes only. The advisor's investment program does not mirror the S&P 500 Index and the volatility of the advisor's investment program may be materially different. The securities or other instruments included in the S&P 500 Index are not necessarily included in the advisor's portfolio and criteria for inclusion in the S&P 500 Index are different than those for investment by the advisor. The performance of the S&P 500 Index ETF was obtained from published sources believed to be reliable, but which are not warranted as to accuracy or completeness. All references to the S&P 500 Index ETF SPY are to the total return form of the ETF, meaning the impact of dividends is included. Unless noted otherwise, the returns of indices presented herein do not reflect fees or transaction costs, nor net dividends, if any. A description of each index follows: The S&P 500 Index, a diversified index that includes the stocks of 500 U.S. listed, large capitalization companies in major industries. Past performance, including hypothetical past performance, is not indicative of future performance. There can be no assurance that the advisor will achieve its objectives. Any performance information, market analysis or data or other information is not warranted by Ciovacco Capital Management, LLC (CCM or Ciovacco Capital) as to completeness or accuracy express or implied, and such information is subject to change without notice. CCM's investment strategies may change from time to time based on market conditions and enhancements to its investment methods and strategy without further notice. This website and the information contained herein are for informational purposes only and do not constitute a complete description of our investment services, funds or strategies. The data in this website have been prepared by CCM and have not been reviewed, compiled or audited by an independent public accountant. The views expressed on this website represent the current, good faith views of the authors at the time of publication. Please be aware that these views are subject to change at any time and without notice of any kind. CCM assumes no duty and does not undertake to update these views or any forward-looking statements, which are subject to numerous assumptions, risks, and uncertainties, which change over time. All material presented herein is believed to be reliable, but we cannot attest to its accuracy. The information contained herein (including historical prices or values) has been obtained from sources that Ciovacco Capital Management (CCM) considers to be reliable; however, CCM makes no representation as to, or accepts any responsibility or liability for, the accuracy or completeness of the information contained herein, or any decision or action taken by you or any third party in reliance upon the data. Some results are derived using historical estimations from available data. Readers are urged to check with tax advisors before making any investment decisions. This memorandum is not an offer to buy or sell or a solicitation of an offer to buy or sell the securities mentioned. The investments discussed or recommended in this report may be unsuitable for investors depending on their specific investment objectives and financial position. The price or value of the investments to which this report relates, either directly or indirectly, may fall or rise against the interest of investors. All prices and yields contained in this report are subject to change without notice. This information is based on hypothetical assumptions and is intended for illustrative purposes only. PAST PERFORMANCE DOES NOT GUARANTEE FUTURE RESULTS. Investments: Not FDIC Insured - No Bank Guarantee - May Lose Value. Investing in securities involves risks, and there is always the potential of losing money when you invest in securities. Before investing, consider your investment objectives and CCM's fees and other expenses. CCM's services are designed to assist clients in achieving discrete financial goals. They are not intended to provide comprehensive tax advice or financial planning with respect to every aspect of a client's financial situation and do not incorporate specific investments that clients hold elsewhere. For more details, see our
Form ADV Part 2 and other disclosures. Not an offer, solicitation of an offer, or advice to buy or sell securities in jurisdictions where CCM is not registered.