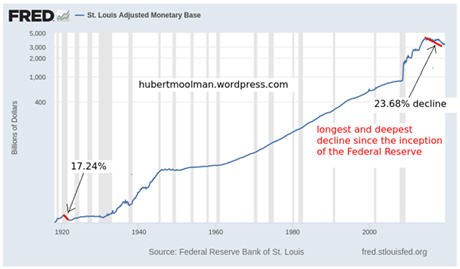
Since 2016, the US Monetary Base has declined by about 23.68%. This is the deepest and longest decline since the Federal Reserve was formed. This should not be ignored.
The last time there was a decline close to this magnitude,there was a sharp deflationary recession. That was the one that occurred from 1920 to 1921.
Below, is a long-term chart of the Monetary base that goes back to 1918:

During the 1920-1921 recession the decline in the monetary base eventually made it into the broader money supply and this caused a significant drop in price levels (between 13% and 18%) during the recession, with wholesale prices dropping as much as 36%.
The current decline in the monetary base has not evolved into a decline of the money supply yet, but it will likely soon do so. Especially if the economy goes into a recession and the stock market collapses.
The monetary base is the foundation part of the money supply, and represents the most liquid part of it. It basically acts like gold in a 100% funded gold standard: it represents the final settlement of a transaction.
If the monetary base is declining then less means to service debt is available and could trigger mass defaults. Cash becomes scarce and suddenly you have a situation where the Fed has to intervene in the repo market like it has been over the last couple of weeks, just to keep the system going.
This problem is not just going to go away without a major crisis and some severe consequences. By my estimation the banking system is broken and is unable to continue creating new credit in its current form, just like a bank is unable to increase its gold holdings under a gold standard when there is distrust of the banking system or that particular bank.
Believe it or not, the reserve banks do not control all the elements in the system: they are not all powerful and unstoppable. The appetite or ability to take on new credit is just not there anymore.
In my opinion, their intervention is not about making the crisis go away (because it won’t), but to protect their interest during the crisis.
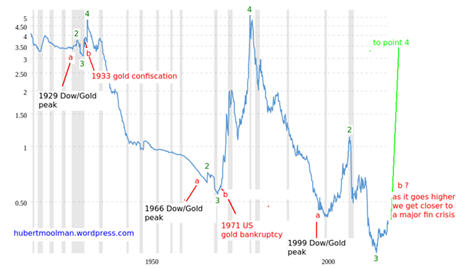
This is likely the beginnings of the expected monetary event I have pointed out before:

The chart shows the ratio of the gold price to the St. Louis Adjusted Monetary Base back to 1918. That is the gold price in US dollars divided by the St. Louis Adjusted Monetary Base in billions of US dollars.(from macrotrends.com)
More details about the chart and original commentary
here.
The bottom at point 3 is now virtually confirmed and we could soon have an event similar to the 1933 gold confiscation (bankruptcy) and the 1971 announcement where the US ended the dollar convertibility to gold (at a fixed rate).
Although both of the historic events were significant, they did not occur during a stock market crash or during a recession. There is a huge potential that the coming event could happen during a major stock market crash and recession.
Therefore, the coming monetary event could be the cause (or at the center) of the coming crisis, whereas with the previous two they were as a result of an ongoing crisis, and came towards the end to “correct” the situation.
Note that a sharp move from point 3 to point 4 on the chart is akin to a bank run on gold holding banks in a gold standard. With the decline in the monetary base and a rising gold price this is exactly what is happening.
For more on this and this kind of fractal analysis, you are welcome to subscribe to my
premium service. I have also recently completed a
Silver Fractal Analysis Report as well as a
Gold Fractal Analysis Report.