Introduction
When the gold price started its move during the summer, someone asked us, "Do you know any 'old and forgotten' projects that aren't very appealing at $1,250 gold but have a lot of leverage on the gold price that would make it viable at $1,500 gold?" An interesting question.
As a lot of projects get recycled during good years in the mining sector, you tend to see the same projects again and again and again. Sometimes the projects have a different name, sometimes the focus is on a different commodity, sometimes there is a new management team with a genuine desire to look at something with a different perspective. Quite often projects get recycled for a quick promotion tour and subsequent pump to offload paper into the hands of unsophisticated shareholders.
But sometimes projects are just gathering dust on the shelves—forgotten by investors and placed on the backburner by management teams while waiting for better market conditions. One of those projects that is "okay but not appealing" at $1,250 gold is the Wind Mountain project in northwestern Nevada, owned by Bravada Gold Corp. (BVA:TSX.V).
Revisiting the Wind Mountain project at $1,500 gold and $17 silver
As the market still isn't too keen on funding pure exploration stories, perhaps Bravada Gold could also revisit its Wind Mountain project, a relatively small, past-producing silver-gold project in Nevada. There is an existing NI-43-compliant resource (containing a total of 900,000+ ounces gold (Au) and 25 million ounces of silver (Ag), divided into 570,000 ounces Au and almost 15 million ounces (15 Moz) Ag in the indicated resource category, and 355,000 ounces gold and 10.1 Moz Ag in the inferred resource category). Of the total resource, approximately 450,000 ounces gold and just over 11 Moz silver are deemed to be pit-constrained.

More work needs to be done to bring in more ounces in an in-pit mineable resource, and although the project is already decently sized, it could use a few additional hundred thousand ounces in a mine plan to make it a well-sought-after heap-leach project. Perhaps using a lower cut-off grade (compared to the 0.155 g/t used in the 2012 mine plan) could help to add a few ounces to the mine plan, but this should only be considered if the current low strip ratio of 0.71:1 could be maintained.
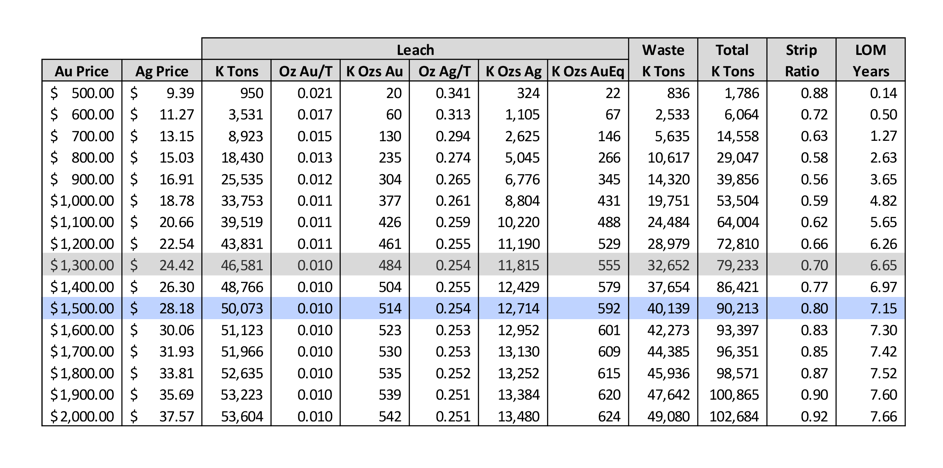
We think it's time to take the dust off the Wind Mountain project. The preliminary economic assessment (PEA) was completed in 2012 and is definitely outdated by now, but as we were curious to figure out the economics at the current gold and silver price, we decided to build our own economic model using the currently appropriate mining and processing costs.
We prefer the 20,000 tonnes per day (tpd) operation, as this would unlock the economies of scale necessary to make the project successful (thanks to these economies of scale the mining cost is 15% lower and the processing cost is 35% lower than in a 5,000 tpd scenario). Looking at the pit optimization results in the original technical report we see that the optimized open pit would contain around 50 million tonnes of rock at an average grade of 0.30 g/t and 7.9 g/t silver. Those 50 million tonnes would represent a 7-year mine life, and we will use this in our base case scenario.

Note: The seven-year mine life could potentially be increased by an additional 1.5 years should Bravada decide to process the historical waste dumps. For now, we are not taking that into consideration at all.
The average recovery rate of the gold is around 60% (which is lower than the 69% recovery rate when Amax Gold was operating the project, so it's not impossible Bravada could see a boost of a few percent in the recovery rate) while only 15% of the silver is being recovered. This is one of the negative features of running a heap leach operation: leaching the gold works well but it's pretty useless for silver as the recovery rates tend to be just 10–40%. We will apply a recovery rate of 63% for the gold and 17% for the silver.
Since the PEA was completed in 2012, the USA has completed a reform of the tax structure. The normal corporate tax rate has decreased to 21% (which should definitely help a U.S.-based mining operation). There also is a specific Nevada mining tax of 5% on the operating profit (which we will assume is the EBITDA [earnings before interest, taxes, depreciation and amortization) if a mining operation generates in excess of $4 million ($4M) in operating profit. Additionally, there is a 2% NSR (net smelter return) on the property, which could be reduced to 1%.
We will assume a normalized corporate tax rate of 25% (consisting of 21% federal corporate taxes, with the balance related to the Nevada mining tax, which is based on the operating profit rather than the revenue or pre-tax income). The "real" tax pressure should be lightly lower (around 23.5–24%), but we will be using 25% to have an additional margin of safety.
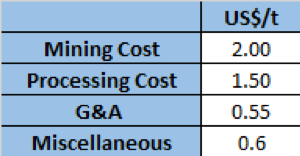
For the operating expenses, these are the inputs we will be using:

The miscellaneous cost per tonne includes the reclamation and haulage costs per tonne. We will also use an average annual sustaining capex of $3M, which will help us to calculate the taxable income. We also used a processing cost of $1.50/tonne ($1.50/t), which is lower than the $2.80 used by Integra Resources Corp. (ITR:TSX.V; IRRZF:OTCQB). Considering Fiore Gold Ltd. (F:TSX.V; FIOGF:OTCQB) has a processing cost of $1.24/t and SSR Mining Inc.'s (SSRM:NASDAQ) Marigold mine has a processing cost of $1.22/t, we feel the processing cost may be exaggerated in the old Bravada Gold PEA and the recent Integra Resources PEA. By using $1.50/t we are already applying a 20% higher cost estimate than Fiore Gold.
Step 1: Calculating the operating cost and revenue per tonne
Applying a strip ratio of 0.7:1, Wind Mountain requires 1.7 tonnes of rock to be mined for every 1 tonne of pay dirt. This means that the operating cost per tonne of rock is $3.4 + $1.50 + $0.55 + $0.60 = $6.05. That's indeed quite low and that's predominantly due to the low strip ratio. Adding the $0.41/t in sustaining capex increases the net operating cost to $6.46/t.
Now we have established the production cost per tonne of pay dirt, we should also figure out the recoverable rock value. Applying a 63% recovery rate to the 0.30 g/t gold grade results in a recoverable rock value of $9.12/t at $1,515 gold. Using the aforementioned recovery rates for the silver and a silver price of $18/ounce, the recoverable value of the silver is approximately $0.78/t, resulting in a recoverable rock value of $9.90/t. This means the margin per tonne of rock processed at Wind Mountain is approximately $3.44/t.
Step 2: Applying the taxes
The initial capex of the project was estimated at $45M. We will apply a cost inflation of 2% per year and assume an initial capex of $52M. We will assume a linear depreciation over the seven-year mine life. This means the annual depreciation charges will be around $7.5M per year.
At a processing rate of 7.3 million tonnes per year (20,000 tonnes per day), the depreciation charges represent approximately $1.03/t, which means the taxable operating margin will be $2.41/t. Applying the 25% total tax rate means the total tax cost will be around $0.60/t.
This means the total net cash flow per processed tonne of rock will be approximately $2.84/t using the current tax situation as base case scenario.
Step 3: A discounted cash flow model
Now that we have established all the parameters above, we can put everything into a simplified DCF (discounted cash flow) model. We will apply a 5% discount rate which is pretty standard for gold projects in Tier-1 mining jurisdictions. The following table shows the after-tax net present value (NPV) 5%.

As you can see, the after-tax NPV5% of Wind Mountain would be approximately US$68M at a gold price of $1,515/oz.
We also ran the numbers on a pre-tax basis (as both Bravada and a potential acquirer of the project may have a pool of tax losses it could apply). The next table summarizes the post-tax and pre-tax NPV5% and internal rate of return (IRR) of Wind Mountain, based on a gold price of $1,515/oz.

Conclusion
Bravada Gold is still focusing on its exploration activities, but at $1,500 gold and $18 silver, it may be an interesting idea to take the dust off the PEA-stage Wind Mountain project again. It won't be a big money maker due to the current limited size of the project, but with an after-tax IRR of 35% at $1,515 gold, it could make sense to give Wind Mountain another look, as the current heap-leach operating scenario combined with the search for the feeder zone could make Wind Mountain appealing again.
Thibaut Lepouttre is the editor of the Caesars Report, a newsletter and mining portal based in Belgium that covers several junior mining companies with a special focus on precious metals and base metals. Lepouttre has a Bachelor of Law degree and two economics masters degrees that have forged his analytical approach to the mining sector. Considered a number cruncher, Lepouttre focuses on the valuations of companies and is consistently on the lookout for the next undervalued mining company.
Disclosure:
1) Thibaut Lepouttre: The author has a long position in Bravada Gold. The author's company has a financial relationship with Bravada Gold. The author determined which companies would be included in this article based on his research and understanding of the sector. Additional disclosures are available here.
2) The following companies mentioned in this article are billboard sponsors of Streetwise Reports: None. Click here for important disclosures about sponsor fees.
3) Statements and opinions expressed are the opinions of the author and not of Streetwise Reports or its officers. The author is wholly responsible for the validity of the statements. The author was not paid by Streetwise Reports for this article. Streetwise Reports was not paid by the author to publish or syndicate this article. Streetwise Reports requires contributing authors to disclose any shareholdings in, or economic relationships with, companies that they write about. Streetwise Reports relies upon the authors to accurately provide this information and Streetwise Reports has no means of verifying its accuracy.
4) This article does not constitute investment advice. Each reader is encouraged to consult with his or her individual financial professional and any action a reader takes as a result of information presented here is his or her own responsibility. By opening this page, each reader accepts and agrees to Streetwise Reports' terms of use and full legal disclaimer. This article is not a solicitation for investment. Streetwise Reports does not render general or specific investment advice and the information on Streetwise Reports should not be considered a recommendation to buy or sell any security. Streetwise Reports does not endorse or recommend the business, products, services or securities of any company mentioned on Streetwise Reports.
5) From time to time, Streetwise Reports LLC and its directors, officers, employees or members of their families, as well as persons interviewed for articles and interviews on the site, may have a long or short position in securities mentioned. Directors, officers, employees or members of their immediate families are prohibited from making purchases and/or sales of those securities in the open market or otherwise from the time of the interview or the decision to write an article until three business days after the publication of the interview or article. The foregoing prohibition does not apply to articles that in substance only restate previously published company releases.