We wrote a very telling research article on October 24
th, 2019. We never published it because we had other articles scheduled to be published over the next few weeks in the queue and because our subscribers get our trade alerts before the general public. At this point, we are sharing that past article as well as some current research for Natural Gas that should be very interesting to you.
Pay very close attention to the original October 24
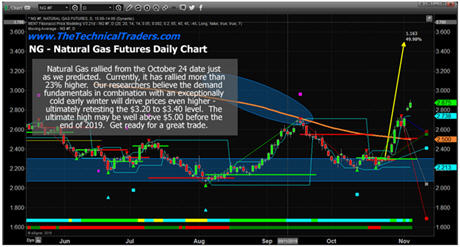
th article, below, and our prediction that the $2.75 to $2.85 level would be a likely target for the upside price rally from the basing level below $2.30. Currently, Natural Gas is trading at $2.87 – reaching our initial target level.
If our research is correct, strong demand and limited supply globally may push Natural Gas well above the $3.20 to $3.40 level after a very brief pause happens near $3.00. In fact, Natural Gas may be getting ready to rally past 2018 highs ($4.93) if the situation presents itself for such an incredible price rally. What would it take for a rally like that to happen? Much stronger demand for natural gas because of an early, extreme winter and extended global demand.
Price reacts to supply/demand imbalances. In this case, if the demand far exceeds the supply capacities headed into the end of 2019, we could easily see Natural Gas rally above $4.00 very quickly. Could it rally even higher and take out the $5.00 level? Absolutely it could if the proper dynamics continue related to supply and demand globally.
Current Daily Natural Gas Chart

Remember to read the link from October 5
th. We've been warning of this move for more than 60+ days and have authored multiple research posts attempting to keep our followers aware of this setup. This trade setup was telegraphed for us many months ago. All you had to do was follow our research and stay aware of the trends as this momentum base setup in October near $2.25.
Natural Gas moved higher by nearly 2% on October 24
th as our researchers predicted nearly a month ago. This incredible momentum base below $2.30 seems to be a very strong support level for Natural Gas. We believe this next rally may be bigger than the last rally which reached a high near 2.70. Our Fibonacci price modeling system is suggesting a target price of $2.95 to confirm a new upside price trend. This means the price would have to rally more than +26.5% from current levels to confirm a potentially much bigger upside price move. Can you imagine seeing Natural Gas climb to above $4.50 again – like last year?
Near the end of October 2018, Natural Gas began an upside price move that really excited investors. The first upside price leg began in mid-September, near $2.75 and rallied to a level near $3.35 – a +21.6% upside price move. After a brief 12 to 15 day pause, another price rally began in early November 2018 near $3.23 and continued very aggressively over the next 11+ days to rally up to $4.93 – a +57% rally.
We issued a natural gas trade using UGAZ to members and this week we locked in 38.7% profit on a portion of our position and there is still a lot of upside potential left.
Is the same type of price advance could be setting up for an early November price rally from the $2.30 level to somewhere above $3.50? This would result in a +50% price rally from recent lows without using any leverage which would be just amazing.
October 5, 2019:
NATURAL GAS RELOADS FOR ANOTHER PRICE RALLY
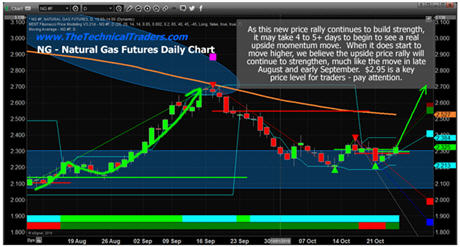
Previous Natural Gas Forecast Daily Chart
Our proprietary Fibonacci price modeling system is suggesting the $2.95 price level is critical for any further upside price action to continue above $3.00. The price must cross above the $2.95 level on a strong closing price basis before we could consider any higher price levels to become valid. Our researchers believe that suggests the $2.75 to $2.85 level becomes a very real upside price target for skilled traders to pull some profits and protect any open long positions.

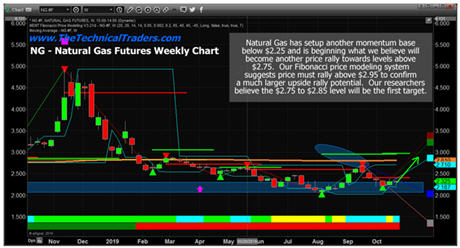
Previous Natural Gas Forecast Weekly Chart
This Weekly Natural Gas chart highlights our Fibonacci price modeling system's results and the Bullish Trigger Level near $2.95 (The GREEN LINE). Pay very close attention to how quickly Natural Gas moved higher in November 2018. If another move happens like that in 2019, we could be setting up for a big gap higher followed by about 10 to 15+ days of incredible upside price action.

Currently, the price of Natural Gas has crossed the Daily Fibonacci price modeling system's Bullish Price Trigger level near $2.29. This suggests that we are now in a confirmed bullish trend as long as the price stays above the $2.26 level on a closing price basis. We would expect a continued moderate price rally from these levels to move price away from the momentum base level over time – before any breakout upside price move may begin.
This could become one of the best trades, besides Silver and Gold, headed into the end of 2019. Get ready for some big volatility in Natural Gas as winter weather takes over much of North America.
November will be the month of breakouts and breakdowns and should spark some trades. I feel the safe havens like
bonds and metals will be turning a corner and starting to firm up and head higher but they may not start a big rally for several weeks or months.
October was a boring month for most major asset classes completing their consolidation phase. Natural gas was the big mover in October and subscribers and I took full advantage of the bottom and breakout for a 15-22% gain and its till on fire and trading higher by another 3% this week already.
If you like to catch assets starting new trends and trade 1x, 2x and 3x ETF’s the be sure to join my
premium trade alert service called the Wealth Building Newsletter.
Happy Trading
Chris Vermeulen
www.TheTechnicalTraders.com