Technical Analysis is the theory that price relates all news, fundamental and correlative future expectations into current and recent price activity. It is the theory that price is the ultimate indicator and that charts paint a very clear picture for those individuals that are capable of understanding the message that is being presented.
In this research article, we are going to highlight the technical analysis components that we believe are painting a very clear picture that an “early warning” signal is flashing very brightly in the US and Global markets right now.
Cross market analysis and methods of rationalizing true price rotation, valuation and trend become the foundation of most technical analysis. Studies, technical indicators, advanced price theory and all the rest of the tools we use are ways for us to better understand what price is actually showing us. Today, we are going to focus on Gold, High Yield Corporate Bonds, and the Transportation Index because combined they are telling us something big is close to happening.
Before you continue, take a second and join
my free trend trade signals email list.
Gold is a safe-haven instrument that measures uncertainty, fear, greed and the future expectations related to a secure global market economy. When a crisis, economic or other uncertainty fears are minimized, Gold tends to move lower or consolidate into a lower price range. When fears, economic uncertainty or any type of crisis event is causing concerns for global investors, Gold then begins to move higher as a measure of protection from risk and fear of any type of crisis event.
Price Of Gold - Bull Flag Within a Bull Market
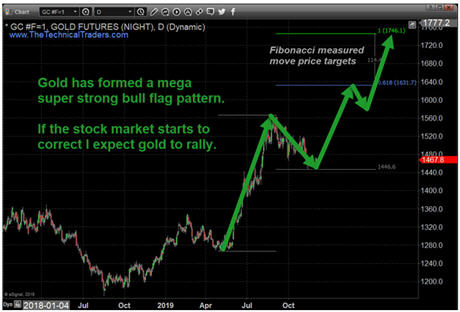
Gold has recently rallied well above the $1400 level and formed a large Bullish Flag pattern. The recent rally above $1400 confirmed the new Bullish Price Trend for Gold which indicates global investors are becoming more fearful of a crisis event or some other type of economic uncertainty.
We believe the next move high in Gold will push prices above the $1625 level, then above the $1745 level. If that happens, we'll know the fear of some type of crisis event is very real and that the Bullish major trend in Gold may continue for many years to come.
We just posted a much more detailed report on the
new 7-year bull market starting for gold and mining stocks, which if you have not yet seen take a look at the charts.

As much as we like to think that Gold leads the market in terms of measuring fear and uncertainty, Corporate Bonds also share a role in the understanding and future expectations related to economic capacity.
If Corporate Bonds begin to sell-off before a major downside market trend begins, it represents a fear that future earnings and the ability to support/service corporate debt levels may be at risk. The way I explain this to people is that it is like a ship “battening down the hatches” and securing the cargo before entering a major storm.
A Corporate Bond sell-off indicates that global investors believe the economy is grinding to a halt and that earnings going to decline – thus putting debt at risk of failure in the future and this is why investors sell their bonds, and they they typically move before the stock indexes do. Think of high yield bonds as a leading indicator by a few days.
High Yield Corporate Bonds - Potential Major Breakdown
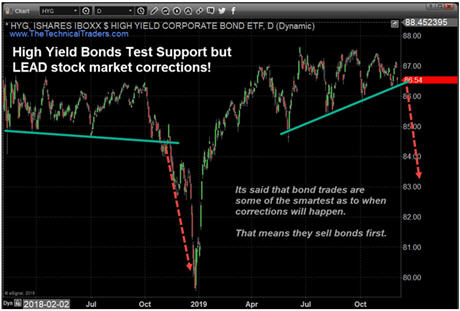
This HYG chart highlights the support channel in Corporate Bonds that appears to be at risk of being broken. If a breakdown in price happens, this downside rotation in HYG would be a very clear warning that the US and global stock markets may be entering a serious price correction period.
If Bonds were to move dramatically lower while Gold rallied, we can only interpret this as fear has really begun to hit the markets and traders are panicking.

Transportation Index - Economic Leading Indicator
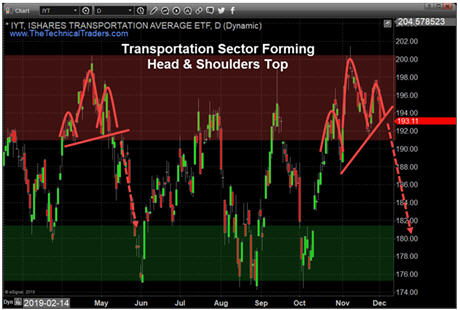
Lastly, take a look at this Transportation Index chart and pay very close attention to the Head-n-Shoulders pattern setup on the right side of the chart. You'll see a similar Head-n-Shoulders pattern in May 2019 – just before a moderate downside price rotation.
As we move into the end of this year with liquidity diminishing and volatility starting to increase, the potential for a dramatic price sell-off becomes even greater. The lack of real market depth and liquidity, as well as this “early warning” set up in the charts, suggests a market breakdown event may be happening right before our eyes. It also may not happen, which is fine also.
As technical traders we do not require price to move in any one direction, we simply follow price and bet on the direction it's moving. But if we do get a breakdown here it could be really exciting especially if you have a trade or two on the right side of the market.

The cross-market Technical Analysis and the chart patterns are suggesting that a peak has set up and that future expectations are much weaker than they were 14 to 18+ months ago.
We recently published this article highlighting some of our proprietary Indicators and Indexes suggesting this recent rally in the US stock market may have been a “euphoric zombie-land rally” with no real support behind it.
Dec 2, 2019:
IS THE CURRENT RALLY A TRUE VALUATION RALLY OR EUPHORIA?
If our analysis is correct, and we get the drop in stocks, it could be a very big downside move.
We believe these charts confirm that price and Technical Analysis are screaming an “Early Warning” signal that price weakness is setting up in the US and global markets. We believe the continued lack of liquidity throughout the Christmas holiday season may prompt a very big breakdown price move at any time in the near future. When any one of these charts begins a price move to confirm these predicted setups, it won't take long for the bigger major trends to follow-through.
As a technical analysis and trader since 1997, I have been through a few bull/bear market cycles. I believe I have a good pulse on the market and timing key turning points for both short-term swing trading and long-term investment capital. The opportunities are massive/life-changing if handled properly.
This week we entered two new trades and it's not too late to get into them before they run higher!
We’ll keep you informed as this plays out with
Wealth Building & Global Financial Reset Newsletter if you like what I offer, join me with the 1 or 2-year subscription to lock in the lowest rate possible and ride my coattails as I navigate these financial market and build wealth while others lose nearly everything they own during the next financial crisis. Join Now and Get a Free 1oz Silver Round or Gold Bar Shipped To You!
Chris Vermeulen
Founder of Technical Traders Ltd.
www.TheTechnicalTraders.com