Staying alert in pat
We advocate a contrarian approach based on a time frame confluence system. When this confluence is absent as of right now, we do not open new large size positions. Most of the times we are positioned already and take possibly some reloads. The following charts will illustrate why at this point a “reload only” environment is present. A range break is necessary to establish a low risk entry zone. Staying alert in pat.
Monthly chart, BTC/USDT, December 6th 2019, “sideways to down”:

Bitcoin in TetherUS, monthly chart as of December 6th 2019
The monthly chart points towards weakness in the market. As much as the month of December candle bounced from a support zone, it still closed on a down note.
Stayng alert in pat, BTC/USDT, weekly chart, December 6th 2019, “bullish long entry zone”:
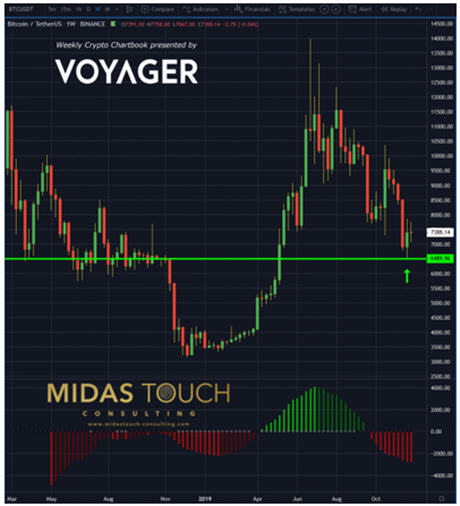
Bitcoin in TetherUS, weekly chart as of December 6th 2019
The weekly chart shows a vastly different picture. We went long aggressively on November 25th with both bitcoin and some portfolio reloads. Those entries were posted live in our telegram channel. Consequently we cashed in handsome profits through partial profit taking based on our quad exit strategy.
BTC/USDT, daily chart, December 6th 2019, “volatile triangle building”:
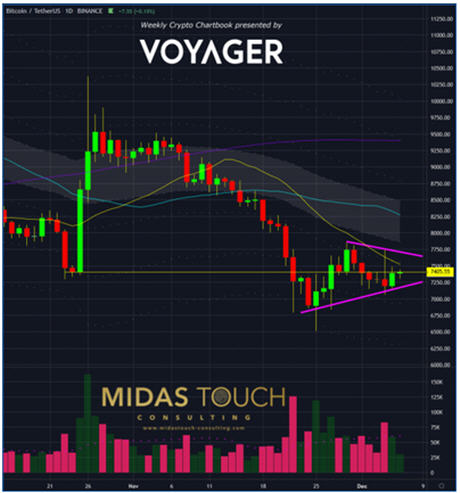
Bitcoin in TetherUS, daily chart as of December 6th 2019
The result of this misalignment of higher time frames is a triangle formation on high volatility on the daily time frame. Prices searching for stability near the supply and demand zone of US$7,400. Volume indicating quite some interest of all time frame players.
Especially the near 10% intra-day advancement (and immediate decline) candle stick candle of December 4th points towards the struggle for direction.
Staying alert in pat
As contrarians we were early positioned and are holding a position in the more likely breakout direction. Avoiding a not unusual struggle zone following, is one of the perks. We even managed to have successful reloads thereafter for income producing results. So why does the headline read “staying alert”?
If you take mid 4th quarter values of bitcoin and compare its annual advances over the last 10 years the results read as follows in percentage profit gains:
2010 to 2011 1,610%
2011 to 2012 244%
2012 to 2013 1,670%
2013 to 2014 70%
2014 to 2015 21%
2015 to 2016 71%
2016 to 2017 825%
2017 to 2018 -2%
2018 to 2019 45%
With an asset class of this profit potential, a larger time frame turning point is not to be missed. Present conditions evoking emotions of uncertainty need a reminder of the true profit potential in relationship to risk.
All charts timely posted in our telegram channel.
If you like to get regular updates on our gold model, precious metals and cryptocurrencies you can subscribe to our free newsletter.