Great traders are often the result of dedication to principle, theory, price study, and a solid understanding of Intermarket market dynamics. The one thing that can't be taught, though, is experience behind the screens and with the markets.
The longer a trader spends working with the charts, trading the markets and studying the trends/indicators, the more knowledge, experience, and capability that trader has in being able to see and predict future price moves.
We believe it is the same way with other professions in life – a professional race car driver, a professional pilot or ship captain. Any profession where an individual is “at the helm” of some vehicle, instrument or live-action event, that individual will, over time, hone his/her skills to be able to foresee and manage certain aspects of the live operation better than someone without the experience.
One might want to call this a “sixth-sense”, but we believe it is simply applied knowledge and experience. These individuals see and feel things that others simply miss or brush off as unimportant.
Trading is the same way and traders will become better and more skilled by following the charts very closely and watching how price reacts to geopolitical and regional economic events.
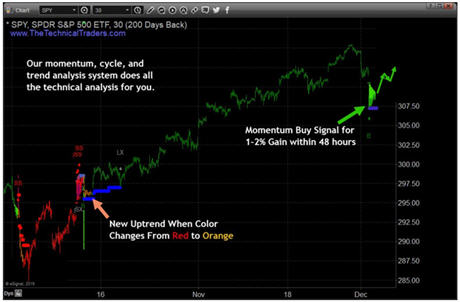
One of our primary price modeling tools is what we call the V10. It has gone through a number of revisions over the years and is capable of running on almost any chart, in any time-frame.
What we learn from using this tool is when and how price rotates, confirms trend changes, sets up new triggers and more. It also helps us to identify price cycles, when we should add-to positions, trim profits or expect a new market rally or correction.
Before you continue, take a second and join my free trend trade signals email list.
V10 Trend Trading Strategy - Average Trade 45 Days
As we expand the use of the V10 price modeling system into other markets, you'll see how changes in price trends can assist us in seeing into the future and preparing for price rotation that others may miss completely.
 Natural Gas V10 Chart Analysis
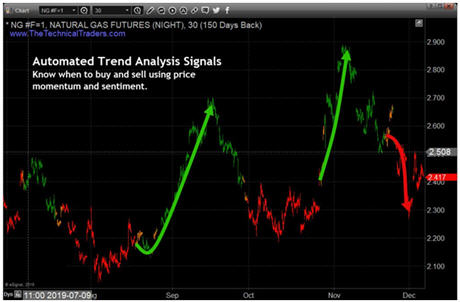
This NG chart highlights a number of price trend rotations (from RED to ORANGE to GREEN, or from GREEN to ORANGE to RED). Each time the color leaves a primary trend color (GREEN OR RED) we have an early warning signal that price rotation is setting up.
You can see the initial uptrend in late August we set up by a RED to ORANGE trend change. The same thing happened in late October. Now, a GREEN to ORANGE trend change setup near mid-November warning us that NG was going to move lower in the future.
These types of setups appear in all types of charts, asset classes, and time-frames and soon we will make different versions available so we have
long term investing, trend trading, swing trading, and momentum trader signals.
 The Power of Cycles Within Price Action
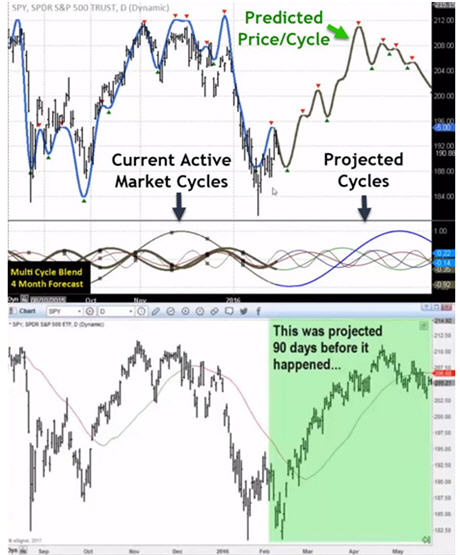
When attempting to interpret price modeling systems or indicators with cycle analysis utilities, it is important to understand that cycles don't drive price moves. Price moves drive cycle rotations. Knowing when price cycles are topping or bottoming can assist traders in understanding where and when new trade setups are viable and when to trim profits off existing trades.
If we know when the most active and relevant cycle is trending, topping or bottoming and the expected cycle length for a potential price trend, then we can make a more informed determination about the viability of the trade setup and risk factors.
We are also able to use the price modeling systems and cycle modeling systems to better understand how far price may move, when we may begin to see price weakness in the trend and other important factors to help us manage our trade properly and reduce risks. This is where things get really interesting and exciting.
Example SP500 Predicted Price Move
 How I Predict Future Price Movement
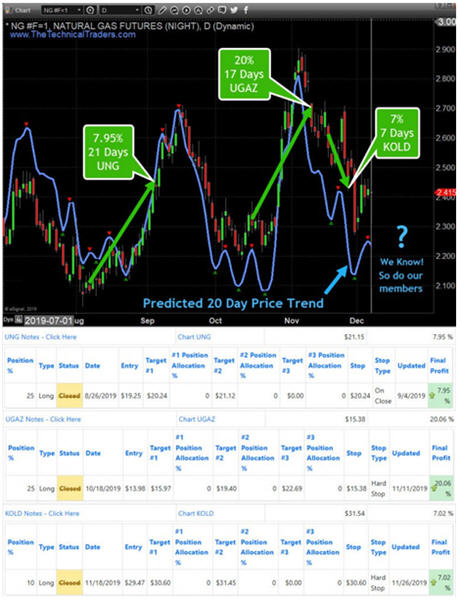
This last chart shows you the price of Natural Gas futures. We have overlaid our proprietary Cycle Modeling tool onto it so you can clearly see how the price has moved in alignment with the cycles. Follow the LIGHT BLUE cycle line on the chart and try to understand that the range/height of the cycle lines does not correlate to price levels. They represent the “intensity” of the cycle peak or trough.
A higher peak on the cycle line suggests this upside cycle peak has a higher intensity/probability than a lower cycle peak. We gauge these rotations as a measure of intensity or amplitude. Lower cycle troughs suggest a price bottom may have more intensity/amplitude in price than a moderately higher cycle trough.
Follow the three-cycle lows starting near early October on this chart. Each of them resulted in deeper Cycle troughs on our Cycle modeling tool. Yet, the real price reaction was to set up a small inverted Head-n-Shoulders bottom pattern. The last cycle trough low didn't result in a deeper price level, but it did result in the completion of the bottom pattern that prompted an immediate upside price rally – more intensity.
We've also highlighted some of our most recent trades related to our analysis using the V10 and our Cycle modeling tool. +35% over the past 4 months on three successful trades – we're pretty happy about that.
Also, keep in mind that we are not showing you what the cycle modeling tool or the V10 is predicting for the future. We reserve that for our valued subscribers/members. We know where the cycle and other predictive modeling systems are telling us the price will go, but we can't share it with you (yet).
 Concluding Thoughts:
Since 2001, our focus has been on learning and mastering the tools we have developed and use as well as the Cycle Modeling tools so that we can follow the markets more closely, learn to provide better opportunities and attempt to identify the highest probability trades for our members.
What we never expected was that our efforts to study, learn and apply these tools would provide us with that “sixth-sense” ability to attempt to see into the future and to attempt to predict 10 to 20+ days into the future.
Our modeling tools share opportunities with us all over the markets and across multiple instruments and time-frames. We recently posted our
gold and gold miners price/cycle forecast here. We focus on Daily and 30-minute intervals for our members, but we see these opportunities across all levels intervals – from 1 minute all the way to monthly/quarterly.
The one thing we are certain of is that our members continually write to us about how important it is to them to have us explain the setups, trends, cycles and future market implications to them in our daily market videos. They don't have to try to learn to do this type of cycle research on their own, we give them the details every morning before the markets open and any trade signal we have for SP500, gold, oil, nat gas, bonds, and more.
Visit my website at
https://www.TheTechnicalTraders.com
Chris Vermeulen
Found of Technical Traders Ltd.