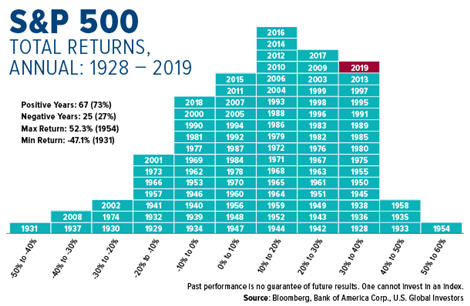
I don’t believe it’s an exaggeration to say that 2019 exceeded expectations for a great number of investors. The S&P 500 Index increased more than 31 percent, putting last year among the very best going all the way back to 1928. Since then, the market has ended in positive territory 73 percent of the time, with a gain “equal to or in excess of 30 percent (like 2019) occurring 19 out of 92 years, or 20 percent of the time,” according to Lauren Sanfilippo, vice president and market strategy analyst at Bank of America Merrill Lynch.
Negative years, by comparison, occurred 27 percent of the time. And even then, years in which stocks fell no more than 10 percent were most frequent, happening 12 out of 25 negative years, or 48 percent of the time.

After such a stellar year, is it time for investors to de-risk, or should they continue to hold their positions?
Stocks Have Been More Likely to End the Year in the Black Than the Red
Looking at the chart above tells me a couple of things in particular. Number one, stocks have historically been much more likely to end the year with a gain than a loss. The implication, then, is that a buy-and-hold strategy has worked out for a lot of investors in general—even those who still may have memories of the tech bubble 20 years ago and financial crisis more than 10 years ago.
And number two, the naysayers and “perma-bears”—those who’ve repeatedly predicted an end to the economic expansion, now in its 10th year—have not only been wrong time and again but may have also discouraged some investors from participating in this historic bull market.
Think back just 12 months ago. At the beginning of 2019, a number of economists and so-called experts were sounding the alarm bell over the inverted yield curve, not to mention U.S.-China trade tensions and slowing global economic growth. And yet look what happened. The market went on to hit as many as 35 record highs from start to finish, ending the year up nearly 300 percent from December 2009.
My point is not that you should put blinders on and ignore the risks completely. But neither should you take action every time Chicken Little warns you the sky’s about to come crashing down. Investors who continued to participate in 2019, despite the warnings, were rewarded.
Mid or Late Cycle?
One of the biggest concerns some investors might have right now is that the U.S. business cycle is maturing and possibly reaching its “natural end.”
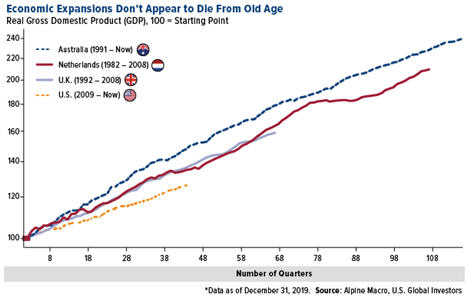
To be clear, business cycles don’t have expiration dates. Although economists aren’t exactly sure what triggers recessions and depressions, most agree that time alone is not enough to kill an expansion.
Take a look at the chart below. At 10 years old, the economic expansion is the longest in U.S. history, but it still has some catching up to do if we compare it to some other nations’ track records. The U.K. managed to go from 1992 to 2008 without experiencing a recession. For the Netherlands, that period was even longer, lasting from 1982 to 2008. Longer still is Australia’s economic expansion, which has continued uninterrupted to this day since it began a remarkable 29 years ago.

Is it likely the U.S. business cycle will last another 19 years? Probably not. But could it happen? Absolutely. And if it did, that would mean we’re mid-cycle right now rather than late-cycle.
Another possible concern is that the market has gone up too far and too fast, and that we’re heading for a bubble. According to analysts at JPMorgan Chase, a bubble is still some time away. Specifically, the S&P 500 would need to climb past 3,700 in the second half of 2020 for it to be consistent with bubble formations in the past, including the Dow Jones Industrial Average in the late 1920s, Japan’s Nikkei 225 Index in the late 80s and Nasdaq 100 Index in the late 90s.
As I write this Wednesday morning, the S&P is just under 3,300, meaning it would need to increase more than 12 percent between now and the second half of the year before investors should worry about a bubble, according to JPMorgan.
One of my favorite ways to participate is with the
Holmes Macro Trends Fund (MEGAX) – explore the fund
here.
Please consider carefully a fund’s investment objectives, risks, charges and expenses. For this and other important information, obtain a fund prospectusby visiting www.usfunds.com or by calling 1-800-US-FUNDS (1-800-873-8637). Read it carefully before investing. Foreside Fund Services, LLC, Distributor. U.S. Global Investors is the investment adviser.
Stock markets can be volatile and share prices can fluctuate in response to sector-related and other risks as described in the fund prospectus.
The S&P 500 Stock Index is a widely recognized capitalization-weighted index of 500 common stock prices in U.S. companies. The Dow Jones Industrial Average, or simply the Dow, is a stock market index that measures the stock performance of 30 large companies listed on stock exchanges in the United States. The NIKKEI 225 Index is a price-weighted index of 225 top-rated Japanese companies listed in the First Section of the Tokyo Stock Exchange. The NASDAQ-100 is a stock market index made up of 103 equity securities issued by 100 of the largest non-financial companies listed on the Nasdaq stock market. It is a modified capitalization-weighted index. An
inverted yield curve represents a situation in which long-term debt instruments have lower
yields than short-term debt instruments of the same credit quality.