Silver is still in consolidation mode since early September, but could be close to a resolution.
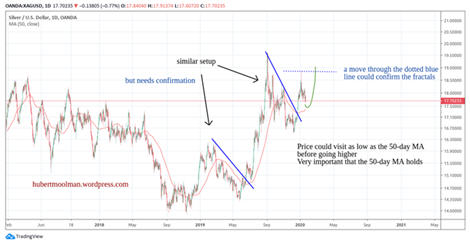
Below, is chart of silver:

On the chart there appears to have formed some fractals. The current one has also broken out at the blue line in middle to late December of 2019, and is currently retracing.
It would be ideal for it to find support at the 50-day MA or higher. Any lower and the pattern might be invalid. A breakout at the blue dotted line would likely confirm the fractal comparison as valid.
There is a very good probability that the comparison is indeed valid. This is based on the following, which is often a leading indicator for significant Silver rallies or Silver bottoms (in a similar manner as how the US dollar is often a
leading indicator for Silver):

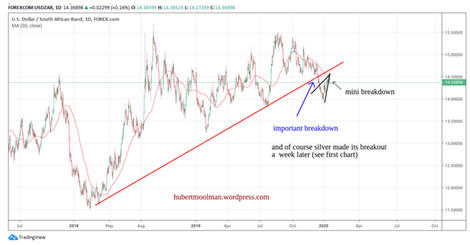
A USD/ZAR (US dollar/ South African rand) chart, which shows an important breakdown in middle December. Of course Silver broke out about a week later (after the USD/ZAR breakdown) from the blue line as can be seen on the first chart.
As is common, the USD/ZAR ratio has now retraced to the breakout area in some sort of rising wedge pattern. The breakout of the wedge could mean that Silver’s current consolidation is close to resolution.
If this USD/ZAR continues its fall, then we could see a massive silver rally soon. We are still in a very positive period for Silver, and my opinion a very good period to accumulate for the long haul.
For more on this and this kind of fractal analysis, you are welcome to subscribe to my
premium service. I have also recently completed a
Silver Fractal Analysis Report as well as a
Gold Fractal Analysis Report.