Gold stocks are often cited as recession proof stocks. Although this has not always been true, they do tend to rise when the economy is in a recessions and/or when the general stock market is in decline or showing relatively little gains.
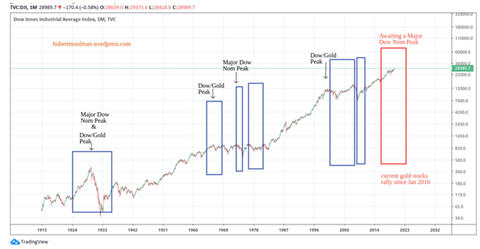
Below, is a long-term chart of the Dow:

I have indicated significant gold stocks rallies with blue rectangles. As you can see that they mostly occur around Dow/Gold ratio peaks and Major Dow peaks.
In fact, the best nominal gold stocks rallies have been after Major Dow peaks (1929 and 1973). This is not really surprising, since many of the factors that drive gold stocks rallies are bad for general stocks.
The red rectangle starts with the current gold stocks rally since January 2016. The best part of this rally will also probably come once the Dow makes a Major Nominal high.
Below, is a long-term chart of the Barron Gold Mining Index (BGMI):

On the chart, I have done a type of cycle analysis using fractals. There are two cycles indicated in the blue rectangles.
The last step in the first cycle (step 4) was the Major Nominal Dow peak in 1973. The BGMI really took off after the 1973 Dow peak was in.
I suspect that once a Major Nominal Dow peak is in, we will see a spectacular gold stocks rally.
For more of this kind of fractal analysis, you are welcome to subscribe to
my premium service. I have also recently completed a
Gold Mining Fractal Analysis Report as well as a
Silver Fractal Analysis Report.