Gold has been rallying strong over the summer 2019 only to fall back into a three-month consolidation between September and December. Now after a crazy spike towards US$1,610, gold is yet again in a consolidation. However, the remaining downside seems to be limited and it is probably only a question of time until gold will break out above US$1,600. Gold - 1,800 until spring?
Gold - 1,800 Until Spring?
Review
Exactly one day before Christmas, gold and the SPDR Gold Trust ETF broke out of their three-month consolidation. This move unleashed unprecedented forces in the gold market, which quickly pushed prices higher over the holidays. Just a week after breaking through US$1,480 gold had reached US$1,530 already. In the context of the geopolitical escalation around the elimination of Iranian general Soleimani, gold prices then shot up towards US$ 1,611 on January 8, 2020, reaching its highest level since March 2013!
After this tumultuous time however, gold finds itself yet in another consolidation phase which last already five weeks. The sharp and fast price spike towards and above US$1,600 was initially digested with a quick drop down to US$1,535 followed by a consolidation around the September highs around US$1,557. After that, gold climbed up again only to reach a lower high at US$1,594. Over the last week, prices have now dropped to a higher low at US$$1,547. Either bulls or bears were able to record sustainable progress over the last five weeks. However, the bulls are still targeting the US$1,600 psychological mark.
Technical Analysis: Gold in US Dollars (Gold - 1,800 Until Spring?)
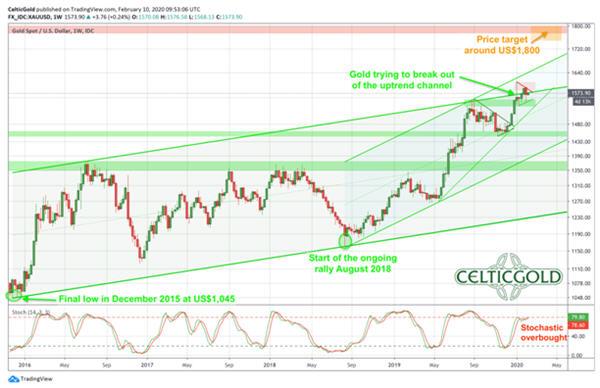
Gold in US-Dollar, weekly chart as of February 10th, 2020. Source:
Tradingview
On the weekly chart, the gold bulls are sitting firmly in their saddle and are now trying to break out of the uptrend channel which has been established since December 2015. If the breakout above the psychological resistance level at US$1,600 succeeds, this step should be completed - at least temporarily. Currently, the sixth weekly candle at the upper edge of this trend channel is developing. A breakout would further exacerbate the bullish trend and should result in a sharp rally towards our target zone around US$1,800.
The overbought stochastic oscillator does not yet stand in the way of a another thrust up. Instead, with both lines remaining above 80 it could rather transform into the embedded, super bullish status within the next three to four weeks. The weekly chart is bullish, suggesting a breakout above US$1,600. The rally should then gain momentum and head for the parabolic final this spring in the US$1,800 range.
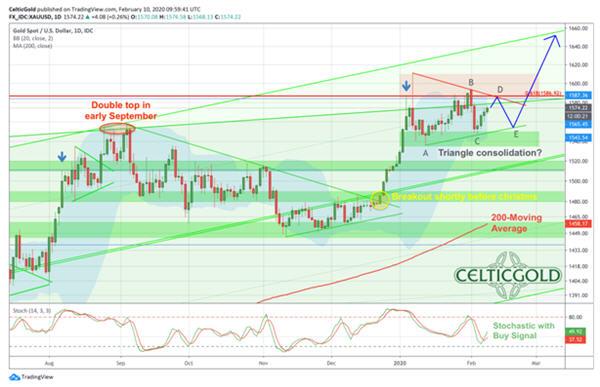
Gold in US-Dollar, daily chart as of February 10th, 2020. Source:
Tradingview
On the daily chart, gold is caught within a consolidation since the 2
nd week of January. The back and forth between US$1,535 and US$1,600 now seems to be taking the form of a triangle. According to this, the maximum downside would be around US$1,550. On the upside, gold would need to clear US$1,590. Overall, gold will likely need more time within this triangle. However, at some point a breakout to the upside is much more probable as triangles usually resolves within the prevailing trend - which is obviously up.
Alternatively, the entire consolidation of the past five weeks could also be an ABC correction. In this scenario gold would be in wave C which should end slightly below the January low (US$1,535). However, prices significantly below US$1,530 are not (yet) foreseeable but would rather increasingly start to question the bullish set up.
In summary, the ongoing consolidation since January 8th has probably reached the last third. However, this consolidation could drag on for another one to three weeks. Between US$1,550 and US$1,555 there could be the last chance of an entry before gold should then ignite the turbo again. A rise above US$1,590 should result in a rapid rise to approximately US$1,645.
Commitment of Traders: Gold - 1,800 Until Spring?
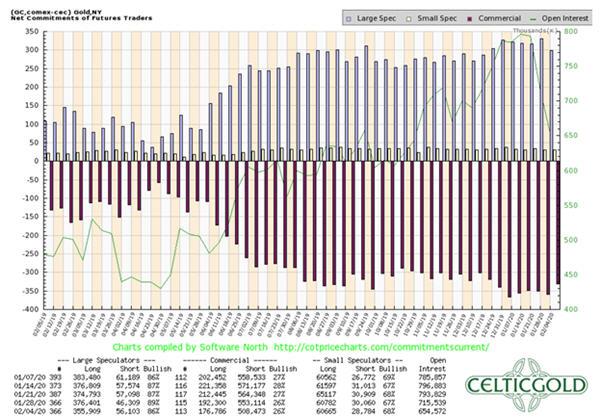
Commitment of Traders for Gold as of February 4th, 2020. Source:
CoT Price Charts
Despite the constantly high gold prices since early July 2019, the situation in the futures market has neither improved nor much worsened. Since the breakout above US$1,400, the commercial hedgers have held an exorbitantly large short position in gold futures. This cumulative net short position has been above 300,000 contracts in the past few months and the commercials have not sold more contracts into the rally towards US$1,600.
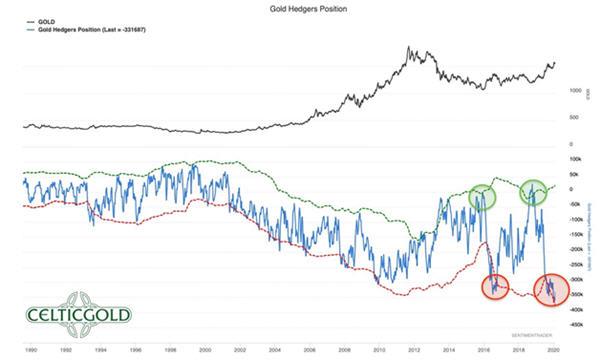
Commitment of Traders for Gold as of February 4th, 2020. Source:
Sentimentrader
Most recently, with gold closing at US$1,552, the commercial short position totaled 331,687 short contracts.
Based on this, the following can be stated:
- The commercial short position has been under water since June 2019!
- It is therefore no longer possible for commercial traders to significantly expand their hedges and their bets on falling gold prices.
- Hence, the bullion banks and professional traders have currently lost control of the gold market. They are no longer able to push the prices down with paper gold!
- However, the professionals are playing at time. With their deep pockets, they are trying to sit out their book losses as long as possible in order to cover their short positions once the next big correction is happening later this year (e.g. 2008).
Overall, the CoT report continues to provide a clear sell signal. The futures market has built up a huge potential for a deep and significant price correction. This will happen soon or later. Before that, however, the gold price can still overshoot to significantly higher prices.
Sentiment: Gold
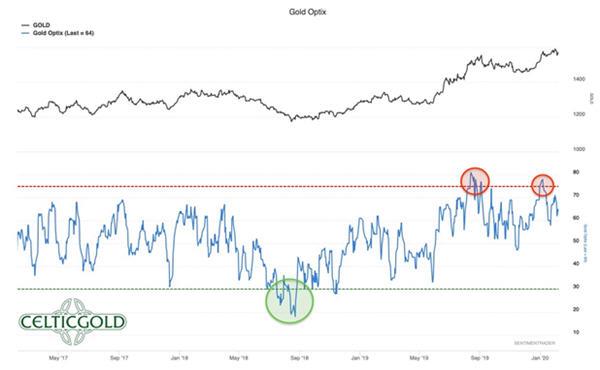
Sentiment Optix for Gold as of February 10th, 2020. Source:
Sentimentrader
In August/September 2019 as well as in January 2020 there were short-term peaks in the sentiment data. Thanks to the rising gold prices, the mood among market participants was too optimistic. So far, however, there has not been any extremely exaggerated euphoria in the past year and a half. Therefore, there are no contrarian signals from sentiment analysis for a sustainable turnaround and trend change in the gold market. Rather, the "grand final" of the party that has been going on since August 2019 is likely yet to come. The mood among gold investors is currently optimistic, but the Gold Optix still has a lot of room for more optimism and greed.
Seasonality: Gold
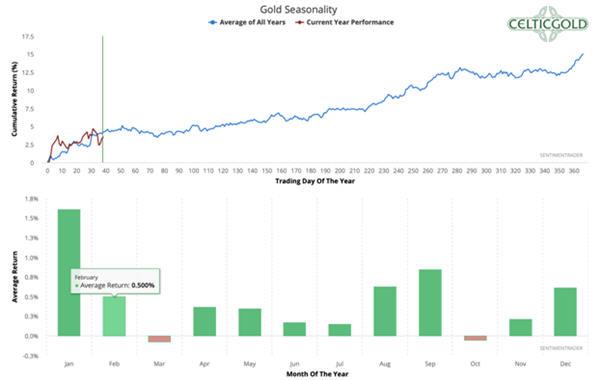
Seasonality for Gold as of February 10th, 2020. Source:
Sentimentrader
Until the end of February or early March, the gold market is definitely supported by a positive seasonal pattern. In bullish breakout years, which definitely is the case since the breakout above US$1,350 in May 2019, gold prices were always able to rally well into the spring of the following year. Therefore, the time window from March to May would be predestined for an important top in the gold market. Typically, there is a complete exaggeration at the very end of a multi-month uptrend. Seasonality does not stand in the way of the expected rally up to US$1,800 in the next one to three months.
Bitcoin/Gold-Ratio
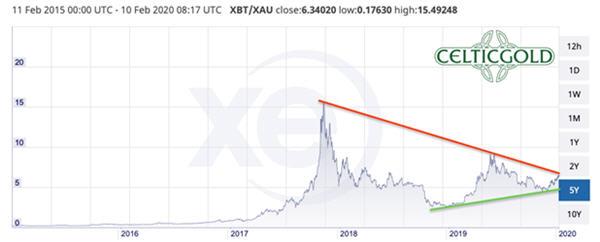
Bitcoin in Gold as of February 10th, 2020. Source:
XE
For one Bitcoin, you currently have to pay 6.34 ounces of gold. In other words, a troy ounce of gold currently costs 0.16 Bitcoin.
In the larger picture, a decision is getting closer in the unnoticed but extremely interesting Bitcoin/Gold-Ratio. Since the high in December 2017, the ratio has been running into a large consolidation triangle for over two years. Not much is missing, and Bitcoin will break out against gold. Already in 2019, Bitcoin outperformed all other asset classes with an increase of over 92%. Since the beginning of the year, Bitcoin´s performance has been a breathtaking 46.7%.
Conservative precious metal investors are therefore well advised to free themselves from their mental blockages and to diversify at least a tiny part of their assets into Bitcoin during the next dip. The king of cryptocurrencies should bring breathtaking gains again this year and will possibly outperform gold again.
Generally, buying and selling Bitcoin against gold only makes sense to the extent that one balances the allocation in the two asset classes! At least 10% and a maximum of 25% of one's total assets should be invested in precious metals (mostly physically), while in cryptos and especially in Bitcoin one should hold at least 1% and a maximum of 5%. If you are very familiar with cryptocurrencies and Bitcoin, you can individually allocate higher percentages to Bitcoin. For the average investor, who is also invested in equities and real estate, 5% in the highly speculative and highly volatile Bitcoin is already a lot!
Conclusion and Recommendation
Gold´s consolidation in recent weeks is not yet over, but everything points to a break above the US$1,600 mark by spring. Because and even though gold has already increased by over US$450 from the low at US$1,160 in August 2018, the bulls remain in control and are not showing any weakness.
Every dip is quickly being bought and the surprises are always happening to the upside. Except for the miserable setup in the futures market (CoT-Report), everything speaks for rising gold prices in the 1st quarter of 2020. Once gold can clear US$1,590, the breakout of the consolidation triangle is underway. Our target price around US$1,800 by spring 2020 remains unchanged. To the downside, gold should ideally not close below US$1,530 anymore. In the longer term, the uptrend that has been going on since August 2018 is still missing its parabolic final!
Source:
www.celticgold.eu