Yesterday, we told our subscribers that probably all markets (or most thereof) are about to correct. And it seems that’s exactly what is happening.
Crude oil is moving higher. The USD Index declined from 103.82 to about 102.72 (at the moment of writing these words). Stocks are moving higher (at least so far in today’s pre-market trading – and
we just took profits on our long positions in stocks) after yet another reversal yesterday.
Today is the first day – since March 3rd – when the S&P 500 futures moved to new intraday high.
The post-reversal rallies are already happening.
This changed and new market landscape impacted the precious metals market in the way that we had outlined in the previous days.
Gold rallied up to about $1,500, while silver rallied to about $12.70. We don’t have the trading data for the mining stocks yet, but it seems that they will soar today, given the above, especially as the main stock indices continue to climb.
This brings us to the main topic of today’s free
Gold-and-Silver-Trading-Alert-based analysis – the mining stocks, and their upside target. Practically everything else (including the target details) written in the previous days remains up-to-date, so we won’t go into details once again today.
The charts below may seem small and insignificant, but the opposite is the truth. They might be small in size, but they are critical in importance, especially given our current trading position (we’re long mining stocks).
The Miners and SPY View
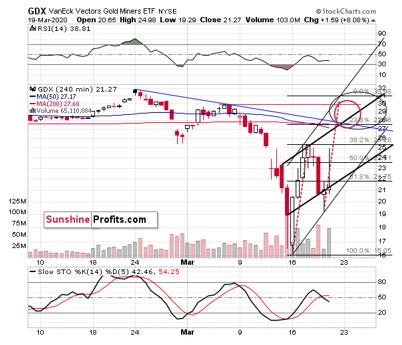
The above charts are 4-hour charts (each candlestick represents half of the daily US session). This zooming-in compared to the regular daily charts is very useful given the very short-term nature of the most recent price swings. It allows for instance for drawing of more accurate trend lines. By the way,
Nadia Simmons discovered (and I verified that it applies to the precious metals market as well) that using trendlines on charts that are more short-term than the 4-hour charts is often misleading – that’s why we’re using 4-hour charts, and not for instance 5-minute charts.
We updated the support and resistance lines based on the most recent lows. This required an update, because miners declined initially yesterday before moving higher. This, in turn, decreased the pace at which the trend channels rise.
Moreover, we added different trend channels that are based on the daily closing prices (thick lines).
Finally, we adjusted the
Fibonacci extension tool to make its predictions more realistic (it’s extremely likely that miners won’t move to new yearly highs shortly), and we added 1-to-1 lines (red, dashed) that show how and when miners are likely to move if they repeat their previous 2-day upswing.
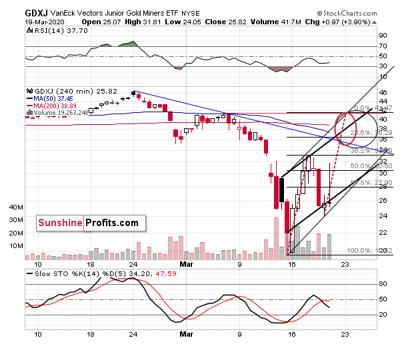
All this creates a relatively broad target area between $27 and $31 in case of the GDX ETF. In case of the GDXJ ETF, the target area is between $35 and $41.5.
There is, however, a part of the GDX target area, where the density of resistance / target levels is particularly big. We marked this area with a red ellipse. It’s between $27 and $30. That’s most likely where the GDX ETF is likely to form its next top. In case of the GDXJ ETF, there’s a good chance that either $36 or $41.5 (approximately) will stop the rally.
Our strategy here is to take profits off the table at the lower border of the target areas (slightly below them to increase the chance of the exit orders getting filled), and examine – based on what the stock market is doing – whether miners are already topping or not. If the S&P 500 is very close to 2700 at that time, we will likely re-open speculative short positions. If the S&P is still relatively far from it (say, at 2600 or so), we will likely wait until it moves higher, taking miners higher with it, and re-open the short positions once S&P 500 is close to 2700, regardless of where the miners are going to trade at that time. The odds are that they would be trading within our target areas – ideally close to their upper borders.
If the above takes place as we outlined, it will be yet another extreme move that we will be making huge money on. We entered the short positions in the precious metals sector on Feb 21
st, we took complete profits from this trade and we went long mining stocks in the final 25 minutes of last Friday’s trading, very close to the intraday lows (about $17 in the GDX). After securing huge gains from the current long trade, it seems that we will have the opportunity to make more similarly epic trades in the following days and/or weeks.
The shape of yesterday’s session (especially the final candlestick) might seem scary, and there is a good reason for it. It’s a massive reversal on big volume. These patterns are very bearish for the short term.
As always, the context is king and if there’s one
gold trading tip that one should keep in mind at all times, it’s exactly this. Looking at the above chart alone, very few traders would want to be on the long side of the market. But why would we limit ourselves to this chart alone, when we have all sorts of market inter-dependencies and we can use them to see what
really happened yesterday.
Bearish reversals (like the shooting star above) represent situations in which the bulls tried hard to rally but were overwhelmed by seller’s force. The above indicates that the seller’s strength is substantial and thus likely lead to even further declines.
Nothing like that happened yesterday. It looks like it, but that’s not what happened.
What happened was that gold declined (most importantly, GLD declined – they have the same opening and closing times as GDX does), and SPY (the ETF for the S&P 500 Index with the same opening and closing times as GDX) moved up by only 0.21%. And yet, the GDX ETF managed to close the session over 8% higher.
Yesterday’s session was a show of miners’ strength, not weakness.
Moreover, please note that it took only a little strength in the S&P 500 and gold, for the GDX to rally almost to its Tuesday’s high. Miners are magnifying the bullish indications and are not fully reacting to bearish ones. This is a show of strength and it’s very bullish for the short term.
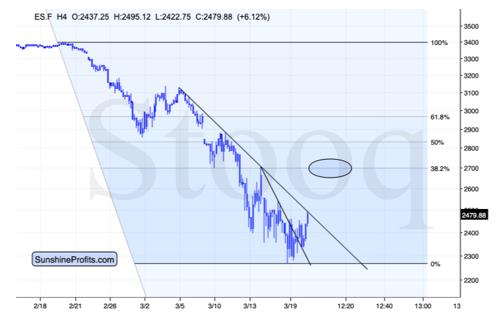
The nearest strong resistance (assuming that stocks break above the declining resistance line, which seems very likely in our view) is provided by the 38.2% Fibonacci retracement that is based on the entire decline. This level also corresponds to the recent local high. That’s where I think (detailed S&P 500 trades are featured in our
Stock Trading Alerts) the S&P 500 is likely to move (and likely to top). This level is at about 2700.
If this is where the S&P is going to top, then it’s about halfway done correcting.
Let’s see how this compares to what’s happening in the USD Index.
The Unfolding USDX Correction
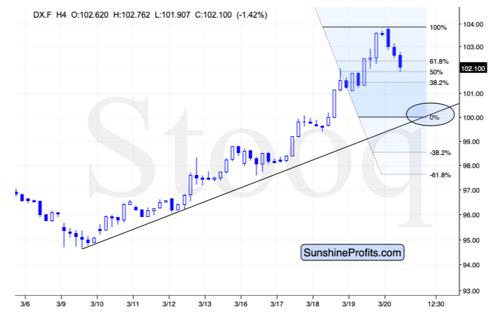
If the USD Index is about to decline to approximately 100 –
as we outlined yesterday – then it’s also halfway done correcting at the moment of writing these words.
This suggests that today’s gains in gold and silver are also likely to increase. Since both precious metals bottomed earlier, it’s unclear whether doubling the rally so far would provide accurate targets. It would probably be more reliable in case of gold, as the yellow metal is more connected to the USD Index than silver is. The latter plunged so heavily recently that the weight of this event is more important than USD’s influence. In other words,
our previous analysis regarding silver’s upside target is even more relevant now.
Gold and Silver in Focus
As a reminder, we think that
silver will rally to about $13.50 - $14 – as a verification of the breakdown below its 2015 low.
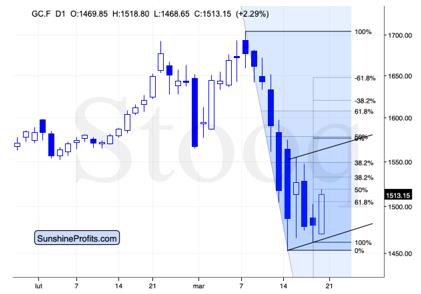
If gold doubles its most recent upswing, it will move to about $1,575, which approximately corresponds to the 50% retracement based on the entire recent decline.
This is approximately in tune with the upper border of the rising trend channel, which might (and likely will) turn into a flag pattern. Based on it, gold could rally to about $1,565 or so, before topping.
Consequently, our predicted target area for gold is $1,565 - $1,575.
Before summarizing, we would like to reply to a question that we received about the pricing of NUGT and DUST (but it might have easily been about any other opposite pair of ETNs like JNUG and JDST). The question was how can they – the opposing ETNs – move in the same direction during the day.
In short, there can be some temporary mispricings in normal times, and they can get bigger in volatile times, such as the current times. These are likely to be averaged out within a day or a few days. Also, please note that it might have something to do with the way these instruments are priced. They are designed to multiply daily gains. And if something moves down by 20% and then up by 20%, it will be trading at 0.8 x 1.2 = 0.96 (or 96%) of the original value. But if these moves were multiplied 3x, and something went down by 60% and then up by 60%, you'd get 0.4 * 1.6 = 0.64 (or 64%) of the original value. If the same thing happens several days in a row, rather counter-intuitive moves could happen. The investors in private investment funds (and in other cases, where capital is professionally managed) might greatly benefit from these instruments, but it’s definitely not appropriate for everyone (and the same applies to all leveraged instruments).
Summing up, it seems that we saw a reversal in all or most markets and that the corrective upswing in many markets (including the precious metals one) is already underway. This move could be sharp and short-lived, so we might take (enormous) profits from the current long position in the miners shortly and enter (likely big) short positions – most likely also in the mining stocks. We expect this to take place within the next several hours to next several days, and we will keep our subscribers informed regarding any changes in the above, and with regard to entering and exiting the trades.
This rally might make one feel bullish – after all, the prices of miners are likely to soar soon. Please be sure to keep in mind that what we saw was the first big wave down of a much bigger move lower, also in the stock market. The
coronavirus stock-market decline has likely just begun and once it continues – and as the rally in the USD Index resumes –
the precious metals market is likely to be hit. Silver and miners are likely to be hit particularly hard.
The real panic on the US stock market will begin when people start dying from Covid-19 in the US in thousands per day. We hate to be right on this prediction, but we expect the number of the total confirmed cases in the US to be greater than the analogous number in China. At the moment of writing these words,
the number of total confirmed cases in the US is 14,250, which is sixth in the world, just behind Germany (15,320 cases).
It’s 2008 on steroids.
Most importantly – stay safe. We’re making a lot of money on these price moves (and we’ll likely make much more in the following weeks and months), but you have to be healthy to really enjoy the results.
Thank you for reading today’s free analysis. Its full version includes detailed upside targets for our long positions in mining stocks that we entered in the last 25 minutes of Friday’s session and that are already very profitable (and these profits are likely to become enormous shortly). We currently offer 10% discount for the first subscription period (even for the yearly subscriptions). Given how volatile the markets are, how profitable our trades just were and currently are, and how much is likely around the corner, the time to subscribe was never better –
subscribe at a discount today.
Thank you.
Sincerely,
Przemyslaw Radomski, CFA
Editor-in-chief, Gold & Silver Fund Manager
Sunshine Profits - Effective Investments through Diligence and Care
* * * * *
All essays, research and information found above represent analyses and opinions of Przemyslaw Radomski, CFA and Sunshine Profits' associates only. As such, it may prove wrong and be subject to change without notice. Opinions and analyses were based on data available to authors of respective essays at the time of writing. Although the information provided above is based on careful research and sources that are believed to be accurate, Przemyslaw Radomski, CFA and his associates do not guarantee the accuracy or thoroughness of the data or information reported. The opinions published above are neither an offer nor a recommendation to purchase or sell any securities. Mr. Radomski is not a Registered Securities Advisor. By reading Przemyslaw Radomski's, CFA reports you fully agree that he will not be held responsible or liable for any decisions you make regarding any information provided in these reports. Investing, trading and speculation in any financial markets may involve high risk of loss. Przemyslaw Radomski, CFA, Sunshine Profits' employees and affiliates as well as members of their families may have a short or long position in any securities, including those mentioned in any of the reports or essays, and may make additional purchases and/or sales of those securities without notice.