Yes, it has been only yesterday when we talked about the mixed signals stocks were sending out. Given yesterday’s surprise finish to their intraday resiliency, it might seem misplaced to interpret those hints as bullish. Yet, that’s exactly what has happened, and the following analysis will thoroughly cast light on all the whys.
S&P 500 in the Short-Run
We’ll start with the daily chart analysis (charts courtesy of
http://stockcharts.com ):
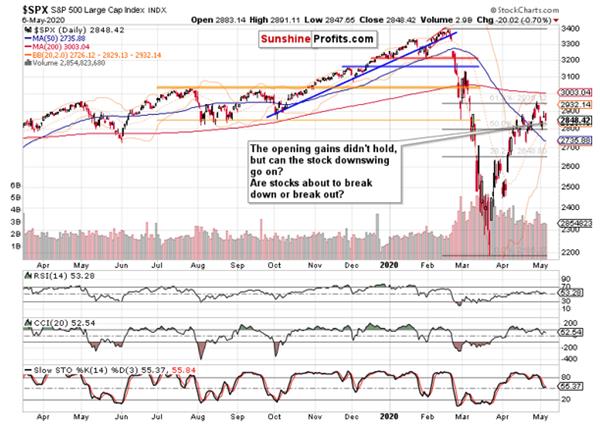
Starting off with the sizable upper knot of Tuesday’s candle, the bulls suffered rejection of higher prices as they raced off the 50%
Fibonacci retracement rendezvous on Monday. On the fundamental news front, all eyes were yesterday on the ADP employment data. Whichever way you look at it, losing over 20 million jobs over a month is plain horrible. We expected the market to sell off on the news – and it indeed initially do that by erasing the opening bullish gap and diving below yesterday’s closing prices.
Hand-in-hand, we looked for the debt markets to decline. Just as the S&P 500, high yield corporate bonds (HYG ETF) also opened higher and kept sliding in confirmation of the developing S&P 500 downswing. Yet as they caught a bid just below $79, they stabilized and attempted to rebound, taking stocks predictably along. That was the moment we deemed our short position no longer warranted, closed it and actually entered a long one.
This is how we have justified the action in one of our
yesterday’s intraday Stock Trading Alert:
(…) High yield corporate debt (HYG ETF) retested the daily lows below $79, and it appears they’re holding. Notably, the local lows support is at $78 – a full dollar lower. Looking at the sensitivity of stocks moving in lockstep with the instrument, that would translate into quite many points before we could talk of an outlook determinant (HYG ETF holding above support with each preceding intraday downswing fizzling out) having changed.
Monday’s intraday HYG ETF low was $78.20, and the S&P 500 low was 2771. For sure, seeing corporate bonds dive well below $79 wouldn’t be a happy sight, but it’s not unimaginable in the short run – especially given the key Friday’s jobs data (these are more important than tomorrow’s unemployment claims). Yet, stocks haven’t tumbled on today’s figures – technology is up, healthcare refused to decline, and the volume behind declining energy, materials and industrials, will likely remain below yesterday’s levels, which would take away from the bearish implications.
So, despite financials being close to their intraday lows (at $21.47), the sectoral outlook isn’t disastrous in any way. Judgmentally, what was the strongest headline driving stocks lower at the start of the week? Trump playing the China tensions card. Stocks are listening to it more than to coronavirus and its job market or other implications.
Thus, it makes sense to interpret market action in light of the magnitude of reactions to unfavorable news and the time that has passed since. Especially after holding up this well against today’s ADP figures. Bluntly speaking, it’s like „throw at me whatever you want, I’ll recover shortly“.
And we don’t know when the next hit will come. Will it be chart-driven, or a headline one? Unless it breaks the back of the HYG ETF (its support, that is), it doesn’t change the outlook for stocks.
The above tendency of the S&P 500 to prove resilient almost no matter what, was clearly more than worthy of consideration. And then the Trump statement expressing doubts whether China would live up to its commitments under the trade deal, came. Given the above-expressed sensitivity to the US – China trade relations, stocks understandably took a dive in the final 30 minutes of trading, across its many sectors and with deterioration seen in the HYG ETF as well.
It would be easy to jump to conclusions and cry that the sky is falling – but would that be justified? As they say, don’t throw the baby out with the bathwater.
The measured way of dealing with such a curveball would be to ask whether the outlook has changed. And as we’ll further see, no – it hasn’t changed, and actually presented us with bullish signs.
But first things first. Stocks are headline-sensitive – we get that. Yet, we articulated our opinion that stock bulls would just dust themselves off and recover – and do so still in today’s overnight session.
And that’s exactly what has happened, by the way. Stocks found a floor and peeked higher even before the strong China export data came in. We’ve also seen the stock futures recovery to continue during the European morning hours.
What is the lesson here?
As for each and every trade, it’s to interpret the signals in their entirety – that’s the only way to get odds in your favor as much as reasonably possible.
As for trading performance over the long run, it’s to dutifully and attentively listen to the market’s many messages on a daily basis – with an open and flexible mind. It’s only over a long enough period of time and with sufficiently large a trade sample collection, that you see the edge you’re working with bring fruits. Christmas doesn’t come regularly in trading, and it would be foolish to jump out of the window because of any single trade.
Coupled with a money management lesson, you must give the edge enough breathing space to work its magic, and risk only as much (or even better, as little) so as to mount the next trade where the odds are again in your favor. And after that, the next one – regardless of the preceding day‘s result. And so on – trading is a marathon, not a sprint.
All right, let’s continue with the S&P 500 assessment and dive into the credit markets next.
The Credit Markets’ Point of View
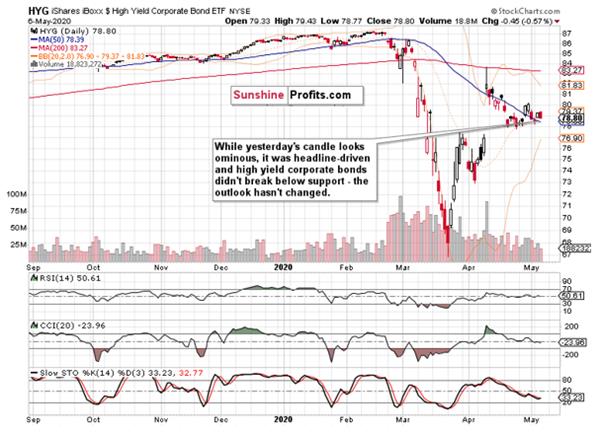
We’ve already discussed how well the high yield corporate debt held up in the aftermath of yesterday’s horrific private payrolls data. Again, the slide below $79 happened in the last 30 minutes of trading, giving us a sizable daily red candle.
But has the HYG ETF outlook changed? It could have broken much lower both early in the session, and towards its end – yet it didn’t. Just as in the Sherlock Holmes story “The Adventure of Silver Blaze”, pay attention to the dog that didn’t bark. And junk corporate bonds aren’t screaming that the sky is falling. Should they break below their recent lows, that would be a different cup of tea entirely.
Let’s proceed with sectoral analysis and key ratios. The messages are worth their weight in gold.
Key S&P 500 Sectors and Ratios in Focus
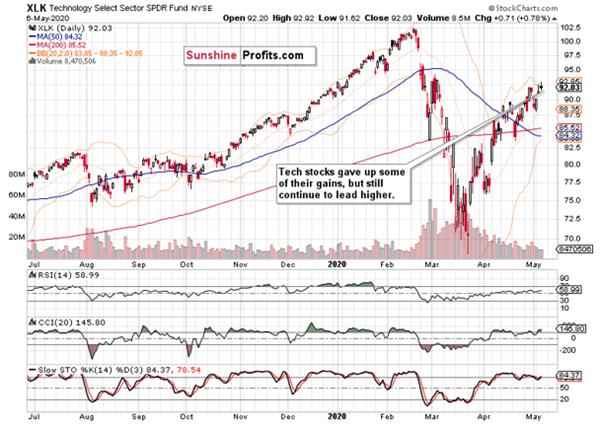
The tech sector opened higher, erased the ADP-driven downswing attempt, and only retreated in the final 30 minutes of trading. And again, this was a sight to see across many S&P 500 sectors. Still, it closed higher, which means that its leadership in the upswing-uphill battle remains intact.
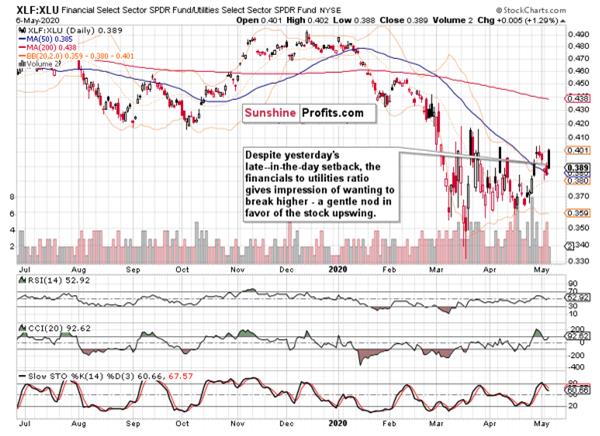
Do you see how high the financials to utilities ratio (XLF:XLU) opened yesterday? Despite the setback, the ratio is making higher lows and trading with an increasingly bullish bias. This bodes well for higher stock prices ahead.
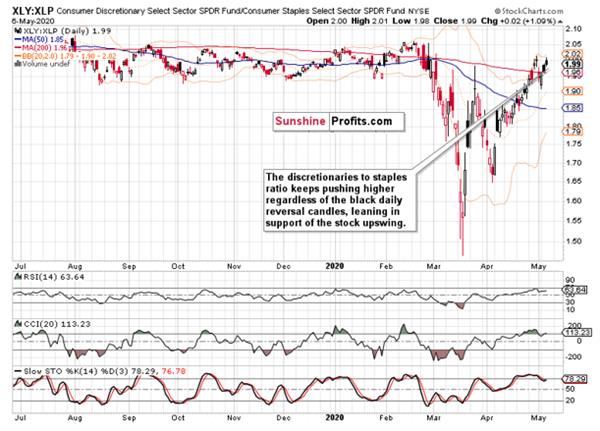
Consumer discretionaries to consumer staples ratio (XLY:XLP) is another leading indicator for stocks. It’s moving up as well, speaking not so softly in favor of the stock upswing.
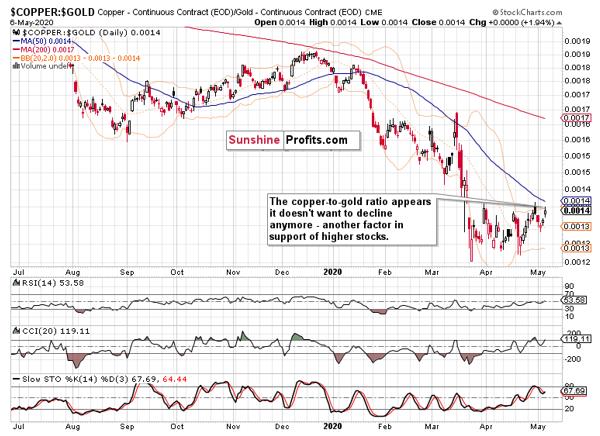
The metal with Ph.D. in economics closed higher compared to gold, as well pointing to the bullish spirits returning.
If you look at the above three ratios, it’s apparent what we mean by the clear bullish signals. Regardless of yesterday’s China-headline-driven downswing, all the three leading indicators have taken the setback in their stride.
That’s what has given us increased confidence that the S&P 500 would rise like a phoenix in today‘s overnight session before you could say Jack Robinson.
And whatever today’s unemployment claims figure, it remains likely for the above reasons, that the stock index would just shake it off.
From the Readers’ Mailbag
Q: I learned that beleaguered Capri holdings and Macy's were removed from S&P 500 not too long ago and replaced by in-favor or better performing stocks, eg. home delivery restaurant or pharmaceutical.... how would that affect your S&P 500 analysis? just imagine this is an on going process.
A: Well, it is an ongoing process of the S&P 500 face lift, and these readjustments happen regularly. S&P 500 is a very broad index, and even if you take the Dow Jones Industrial Average (DJIA) only, its 30 stocks composition has seen 6 changes in the last 10 years. But could a finger be pointed on the chart, and meaningfully explain consequences of getting a particular stock in or out? No, and therefore it doesn’t materially change the index analysis at the level we look at it on daily basis.
Q: your stop-loss is at xxxx or about x%, however, if I buy 3x ETF, what should the STOP be and profit target in percentage term?
A: On
Apr 30, we’ve answered a very similar question that you might want to review.
Here’s the gist. As for the leveraged ETFs, please note that it really depends on their underlying assets (i.e. the ETF’s construction). Generally speaking, they are designed to magnify the intraday moves. If I were in your place, I would look at how the instrument performed during the recent upswings and downswings in the S&P 500 – did it roughly match the index move? That will serve as a useful guideline on where it’s sensible to place any kind of limit or market orders. If it hasn’t exactly matched that index move, a recalculation of what to reasonably expect from the instrument should the S&P 500 move to this or that level, is a sensible approach.
Finally, you’re asking about the stop-loss percentage. We’ve already discussed how important it is to risk moderately per each trade so as to be able to experience the edge working in our favor over the long run. In the overview of Trade Results at the Performance page of my home site, you’ll see the percentage of account risked on each past trade. That’s a key building block in the money management, because it allows you to risk only as much as you are comfortable with in any trade. At the same time, we manage our open trades according to the prevailing outlook, which means that not every take-profit or stop-loss order has to be hit to take us out of the open position.
Capital preservation is the rule number one. The offense wins matches, while the defense wins championships.
Summary
Summing up, stocks proved resilient in the face of grim employment data, and the key corporate credit market has held up well through the day. Seeing that coupled with the sectoral performance, has shifted our bias from short to long. The bullish outlook is supported by the leading ratios’ performance, which goes to confirm the steadfast recovery from yesterday’s Trump doubts regarding the China trade deal. The bulls certainly appear in the mood to keep climbing the wall of worry again, and our long position remains justified.
We encourage you to sign up for our daily newsletter - it's free and if you don't like it, you can unsubscribe with just 2 clicks. If you sign up today, you'll also get 7 days of free access to our premium daily Stock Trading Alerts as well as our other Alerts.
Sign up for the free newsletter today!
Thank you.
Monica Kingsley
Stock Trading Strategist
Sunshine Profits - Effective Investments through Diligence and Care
* * * * *
All essays, research and information found above represent analyses and opinions of Przemyslaw Radomski, CFA and Sunshine Profits' associates only. As such, it may prove wrong and be subject to change without notice. Opinions and analyses were based on data available to authors of respective essays at the time of writing. Although the information provided above is based on careful research and sources that are believed to be accurate, Przemyslaw Radomski, CFA and his associates do not guarantee the accuracy or thoroughness of the data or information reported. The opinions published above are neither an offer nor a recommendation to purchase or sell any securities. Mr. Radomski is not a Registered Securities Advisor. By reading Przemyslaw Radomski's, CFA reports you fully agree that he will not be held responsible or liable for any decisions you make regarding any information provided in these reports. Investing, trading and speculation in any financial markets may involve high risk of loss. Przemyslaw Radomski, CFA, Sunshine Profits' employees and affiliates as well as members of their families may have a short or long position in any securities, including those mentioned in any of the reports or essays, and may make additional purchases and/or sales of those securities without notice.