The US Dollar Index is getting close to the breakdown that will signal a massive Silver rally. A type of Silver rally that was last seen in the 70s, when Silver went from around $5 to $50.
The market has virtually completed a full cycle to set up the next Silver rally. See this long-term US Dollar Index chart:
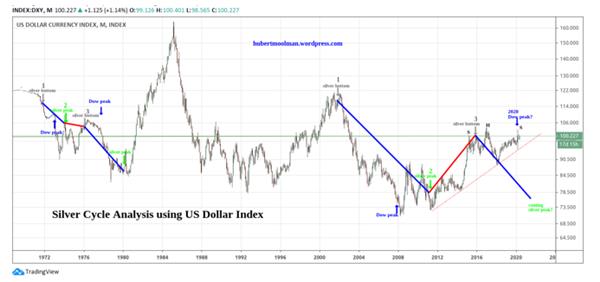
On the chart, I have marked two fractals (1 to 3), with a fractal virtually representing a cycle. Both fractals exist in similar conditions – relative to the relevant Dow/Gold ratio peaks (1966 and 1999), as well as Dow peaks. Both fractals span over the period of the first phase of the Silver bull market during the 70s and the current era (2001 to 2017), respectively.
If the comparison is justified, then the US Dollar index will fall significantly during the coming months. Given the fact that
Silver has traditionally had its strong rallies during times when the US Dollar Index was falling, this bodes well for a Silver rally.
We are now just after the Dow peak in the current cycle. If the Dow peak in Feb 2020 was indeed the top, then we are likely to see a Silver rally that will at least match the x10 during the period from 1977 to early 1980.
A breakdown of the US Dollar Index at the red dotted line is where things could get really interesting.
For more on this chart and this kind of fractal analysis, you are welcome to subscribe to
my premium service. I have also recently completed a
Silver Fractal Analysis as well as a
Gold Mining Fractal Analysis Report.