TSX:ABX - Post Discussion
Post by
smallcaptdr on Sep 01, 2022 5:55pm
Double Bottom
A double bottom looks similar to the letter W and indicates when the price has made two unsuccessful attempts at breaking through the support level. It is a reversal chart pattern as it highlights a trend reversal. After unsuccessfully breaking through the support twice, the market price shifts towards an uptrend 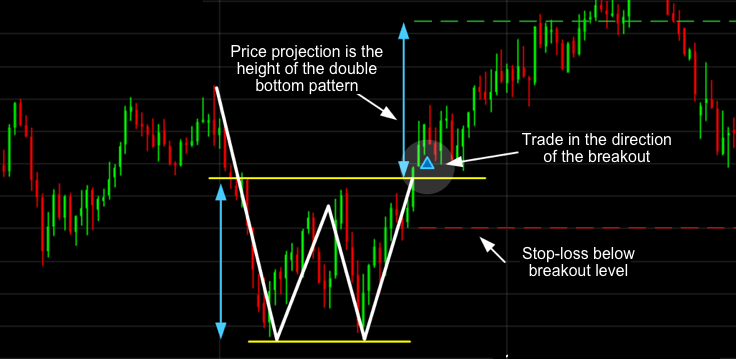
Be the first to comment on this post