Looking through a Golden LensThe year-end is always an interesting time to reflect at what the majority of investors focus upon when it comes to “building their wealth”. And seeing that the majority of investors and market money is actually centered in the US, the focus is always more telling when directed at American investors.
In general, the choice of long-term investment for US investors is as follows:
https://www.dgpinnacle.com/img/user_images/31146.jpg 
Basically, 60% of all investment money is centered around Real Estate and the general Stock market. The largest allocation being towards real estate. The Census Bureau provides data on median new home sales, but nothing for existing home sales. This data uses the non-seasonally adjusted housing price index data from Robert Shiller and the FHFA to mash up these values. Looking at the historic returns, I would say that real estate has been a “real winner” over time, and it has proven to be an astute allocation of investment money over the long term.
https://cdn.dqydj.com/wp-content/uploads/2020/09/historical-home-prices-us-1951-2020-768x595.png 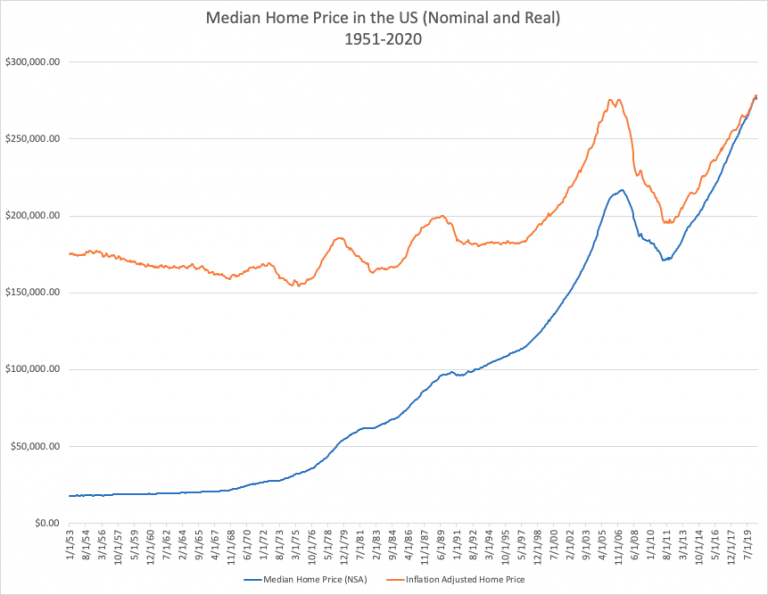
But we must all remember one fact: This is all viewed through the lens of the $US. Even an inflation adjusted $US (as shown above) has proven out to be a good investment choice. However, if we swap the $US lens for a golden lens, we see a very different view.
The real estate to gold ratio measures the amount of gold it takes to buy a single-family home. The Shiller Case Homes Price Index seeks to measure the price of all existing single-family housing stock. Based on the research of Robert Shiller and Karl Case the index is generally considered the leading measure of U.S. residential real estate prices. The ratio has an interesting historical track record for identifying turning points in long-term gold price trends. When exactly is one of the assets "cheap" and what is "expensive"? Answering that question is where the Gold/Housing ratio is quite useful. As there is no dollar component in the ratio itself, inflation concerns drop out, and we are left with the value of two of the most popular tangible investments relative to each other.
https://pricedingold.com/charts/CSXR-1987.png 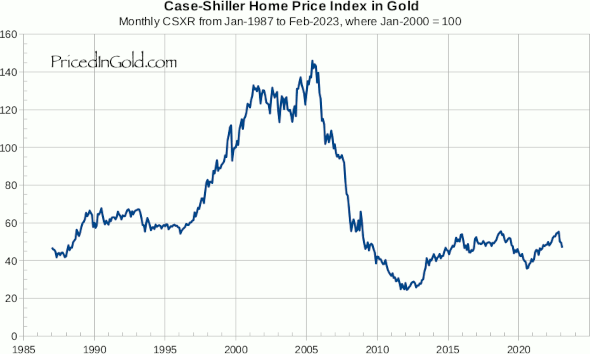
Data Sources
If we go all the way back to 1890, we can see an even more interesting historic pattern when it comes to residential properties priced in gold.
https://setupselfdirectedira.com/nuwireinvestor/wp-content/uploads/2014/08/HomePrice-vs-gold.png 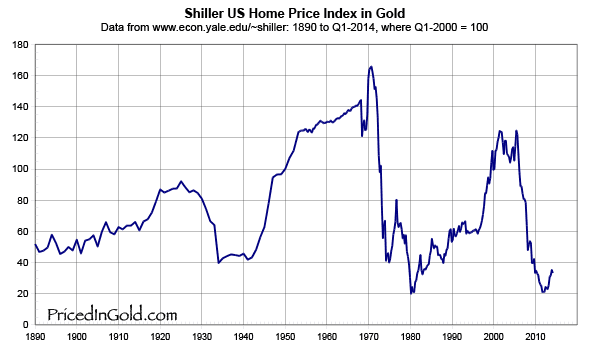
But since the majority of us are under the age 100, let’s just keep things in “modern times” to when the $US went off the gold standard in the early 1970s. This final chart shows the median price of a new home in the US, both in dollars and gold. This is a log chart, necessary to encompass the huge increase in USD prices since the 1960s. Prices today (in gold) are about the same as they were in the 1980s, and far below their peaks in the 1960s and early 2000s.
Case-Shiller US Home Price Index, Seasonally Adjusted (SA), in USD and gold:
https://pricedingold.com/charts/CSUS-USD-1975.png 
So, what can we conclude? Well, for one thing it is clear that real estate and single-family dwellings has been an absolutely fantastic investment in $US dollars. But in the same manner, we can also see that the same real estate asset allocation priced in gold has actually been a mediocre (if not terrible) long term investment.
In addition, for those that believe that real estate is now a great investment on the eve of a secular PM bull market and asymptotic $US debasement, I would seriously examine that choice much more closely. In addition, for those that believe that the “great white whales” of the general stock market have done better, I would also examine how well they have fared in this century. I once again refer to the standard bell-weather of US stock investing: Very rarely has it bettered the long term returns of gold.
https://personal-financial.com/wp-content/uploads/2020/12/Warren-Buffett-will-never-open-his-eyes-to-Bitcoin-for.png  By all current metrics, historical data, and financial logic, the “golden line” in the first chart shown at the top of this post should be the largest allocation of investment capital at the present time.
 Happy New Year.
Tx