Join today and have your say! It’s FREE!

Become a member today, It's free!

We will not release or resell your information to third parties without your permission.
Please Try Again
{{ error }}
By providing my email, I consent to receiving investment related electronic messages from Stockhouse.

or

Sign In

Please Try Again
{{ error }}
Password Hint : {{passwordHint}}
Forgot Password?

or

Please Try Again {{ error }}

Send my password

SUCCESS
An email was sent with password retrieval instructions. Please go to the link in the email message to retrieve your password.

Become a member today, It's free!

We will not release or resell your information to third parties without your permission.
Quote  |  Bullboard  |  News  |  Opinion  |  Profile  |  Peers  |  Filings  |  Financials  |  Options  |  Price History  |  Ratios  |  Ownership  |  Insiders  |  Valuation

iShares Global Materials ETF V.MXI


Primary Symbol: MXI

The fund seeks to track the investment results of an index composed of global equities in the materials sector. The fund seeks to track the investment results of the S&P Global 1200 Materials Index (the Underlying Index), which measures the performance of companies that S&P Dow Jones Indices LLC (SPDJI), a subsidiary of S&P Global, Inc., deems to be part of the materials sector of the economy and that SPDJI believes are important to global markets. It is a subset of the S&P Global 1200.


ARCA:MXI - Post by User

Comment by wilwalon Jan 26, 2016 10:05pm
164 Views
Post# 24496688

RE:interesting...

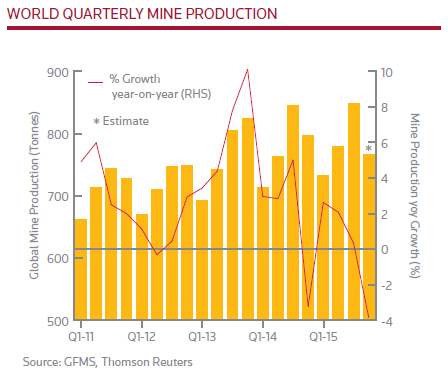
RE:interesting...I don't like predicting gold price but I am going to stick my neck out and say yes, more or less.  The reason came in the news today that Q4 indicated a 4% supply contraction.  Q3 had the first small decline in years, and in my view, about 7 years of increasing supply is the reason for the pullback in gold prices.  If subsequent quarters confirm a steady decline due to all the capital cuts in the last 3 years, we should see a steady rise this year (assuming no crazy "fear events").

Here is the chart that says "bottom" to me:

User image
<< Previous
Bullboard Posts
Next >>