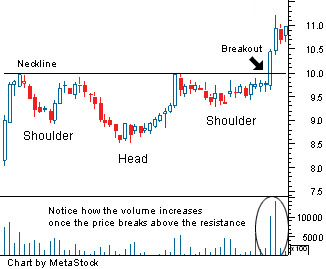
Inverse Head And ShouldersThe stock has formed a nice inverse head and shoulders pattern that is symmetrical through this week. Looks set to run up now on the forthcoming news and a clearer technical picture. Should be the last opportunities to buy in before a rise at hand now.
Definition of 'Inverse Head And Shoulders'
A chart pattern used in technical analysis to predict the reversal of a current downtrend. This pattern is identified when the price action of a security meets the following characteristics:
1. The price falls to a trough and then rises.
2. The price falls below the former trough and then rises again.
3. Finally, the price falls again, but not as far as the second trough.
Once the final trough is made, the price heads upward toward the resistance found near the top of the previous troughs. Investors typically enter into a long position when the price rises above the resistance of the neckline. The first and third trough are considered shoulders, and the second peak forms the head.