A number of stocks delivered huge gains in the weeks following the 2016 election on the hope that President Donald Trump’s
policies would create major earnings tailwinds for certain sectors of the economy. Among the biggest post-election winners was
United States Steel Corporation (NYSE: X).
From Election Day to March 1, U.S. Steel’s share price surged 89.3 percent on hopes that Trump’s aggressive infrastructure
spending plans and anti-China rhetoric could provide significant demand for U.S. Steel. However, Trump’s false start on healthcare
reform and softening stance on China now have investors concerned about when or if he will follow through with many of his campaign
proposals.
Investor skepticism is clearly reflected in U.S. Steel’s chart. The stock is down 24.2 percent since March 1, and it is now
trading up against an important technical level.
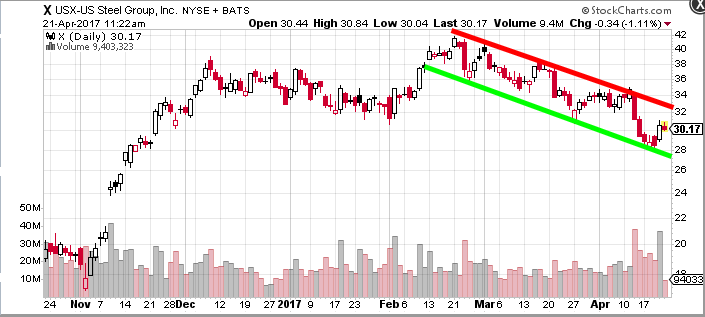
A short-term chart of U.S. Steel reveals the narrow, bearish channel that the stock has been trapped inside for roughly two
months now. The bottom of that channel currently sits at around $28, while the top of it stands at $32. However, looking at U.S.
Steel from a longer-term perspective reveals a much more bullish chart.
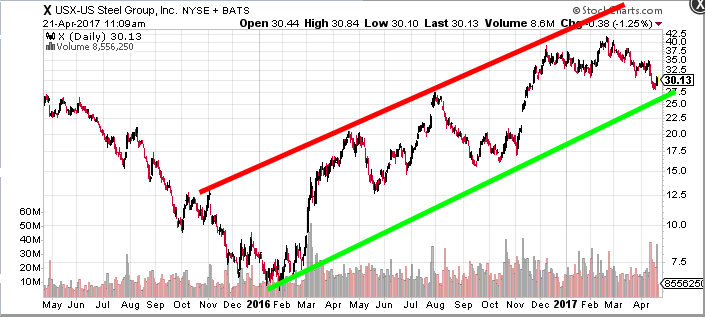
Since the stock bottomed in early 2016, it has been trending higher for more than a year. The $27–28 region represents the
bottom of the longer-term channel as well, meaning that one of the trends will win out in coming weeks.
If U.S. Steel breaks down below $27, it could be headed back to the $20 level which served as resistance in September and again
in October. If it breaks out above $32, it could be an indication that the longer-term trend has won out and U.S. Steel could be
once again headed for new highs above $42.
Axiom analyst Gordon
Johnson is betting the stock is headed lower.
“In short, as we have stated a number of times in the past, we believe inventory is being built in anticipation of a ‘Trump
effect’ via imminent infrastructure spend and tax policy (which we do not see taking effect in 2017) against a backdrop of ‘tepid’
end-market demand,” Johnson said in March.
Technical traders will be watching how the stock reacts to U.S. Steel’s Q1 earnings, expected out after the market close on
April 25.
Joel Elconin contributed to this article.
Related Link:
7
Things You Need To Know About Dodd-Frank's Potential Replacement
Latest Ratings for X
| Date |
Firm |
Action |
From |
To |
| Apr 2017 |
Longbow Research |
Initiates Coverage On |
|
Neutral |
| Feb 2017 |
Cowen & Co. |
Upgrades |
Market Perform |
Outperform |
| Feb 2017 |
Argus Research |
Upgrades |
Hold |
Buy |
View More Analyst Ratings for
X
View the Latest Analyst Ratings
© 2017 Benzinga.com. Benzinga does not provide investment advice. All rights reserved.