- Focus on Higher Return Projects Results in Approximately $300 Million Capital Expenditure Reduction and $60 Million Expense Savings
- Fiber Strategic Review Active and Ongoing
HOUSTON, June 11, 2024 (GLOBE NEWSWIRE) -- Crown Castle Inc. (NYSE: CCI) ("Crown Castle") today announced plans to enhance operational performance and updated its full year 2024 outlook.
"As we have continued to progress the strategic and operating review of Crown Castle's fiber business, we are implementing changes designed to drive operational efficiencies and to enhance returns in fiber solutions and small cells. These changes are being implemented, regardless of the outcome of the strategic review, which remains active and ongoing," stated Steven Moskowitz, Crown Castle's President and Chief Executive Officer. "With these changes, we are pursuing a more focused sales effort to target on-net and near-net demand and, critically, increasing return thresholds on all new growth opportunities to drive a more efficient use of capital. We believe implementing these changes will lower our capital expenditures on lower-return opportunities in 2024 by $275 million to $325 million while maintaining our expectations for revenue growth across towers, small cells, and fiber solutions over the next several years. Because this reduction in capital expenditures leads to reduced activity, we are also reducing staffing levels and closing certain offices, which we expect will drive approximately $100 million of annualized run-rate operating cost savings, significantly improving our ability to convert incremental revenue into cash flow. We believe this increased focus on cost discipline and capital efficiency will enable us to generate higher returns and reduce our reliance on external capital to fund organic growth opportunities."
CHANGES TO OPERATING PLAN
In January 2024, Crown Castle initiated a comprehensive strategic and operational review of its Fiber segment. While the strategic review remains underway, with engaged third parties, the Company has concluded its operational review and is implementing changes to its operating plans based on the findings.
As part of the operational review, Crown Castle identified opportunities for significant future enterprise fiber and small cell demand from locations that are on or close to the Company's existing high quality fiber footprint, which consists of 90,000 route miles of high-strand-count fiber in 48 of the top 50 most populated cities in the U.S.
Consequently, Crown Castle believes there is an opportunity in small cells to increase the number of collocation nodes and increase returns on new anchor nodes by focusing on locations nearer to its existing network. With this shift in approach, Crown Castle believes it can reduce the capital intensity of small cell projects by narrowing its investment focus to concentrate on a higher mix of collocations and continue building network-adjacent anchor nodes, while de-emphasizing greenfield locations the Company historically targeted. Crown Castle has already started to make changes to some projects that no longer meet the Company's targeted investment focus and will continue working collaboratively with customers to modify or cancel additional projects that may benefit all parties while positioning the Company to achieve higher incremental returns. The Company expects these operational changes, in combination with other delays in delivering some in-process small cell projects, to result in a reduction of 3,000 to 5,000 new revenue-generating small cell nodes in 2024 and a reduction in new leasing activity of approximately $15 million in the year. Taking these changes into account, Crown Castle continues to believe there is sufficient demand to grow small cell revenues by double digits over the next several years.
Similarly, in its fiber solutions business, Crown Castle believes it can reduce discretionary capital expenditures going forward. Given the magnitude of market opportunities near its existing assets, Crown Castle believes it can improve capital efficiency while achieving annual organic revenue growth of 2% in 2024 as it transitions to the new sales strategy before returning to long-term annual organic revenue growth in fiber solutions of 3% beginning in 2025.
As a result of the modified strategy the Company is placing on small cell and fiber solutions investments going forward, Crown Castle expects to reduce gross capital expenditures in its Fiber segment by $275 million to $325 million in 2024 and is reducing staffing levels by more than 10% from current levels. The staffing reductions, in addition to other operational savings, which will primarily impact the Fiber segment and corporate departments, are expected to generate approximately $100 million in annualized run-rate cost savings, approximately $60 million of which is expected to benefit full year 2024 results.
OUTLOOK
This Outlook section contains forward-looking statements, and actual results may differ materially. Information regarding potential risks which could cause actual results to differ from the forward-looking statements herein is set forth below and in Crown Castle's filings with the SEC.
The following table sets forth Crown Castle's current full year 2024 Outlook, which includes the following key changes from the previous outlook issued on April 17:
- A $30 million decrease to site rental revenues, including a $30 million decrease to non-cash items. Site rental billings remains unchanged as a $25 million decrease to recurring revenues from lower fiber solutions and small cell activity is offset by a $25 million increase in small cell non-recurring revenues primarily related to early termination payments.
- A $95 million decrease to net income, primarily reflecting approximately $110 million of restructuring charges related to staffing reductions and office closures.
- A $5 million increase to Adjusted EBITDA as the $30 million reduction to site rental revenues and approximately $25 million of advisory fees primarily related to the recent proxy contest are more than offset by a $60 million decrease in costs generated by staffing reductions and office closures.
- A $25 million increase to AFFO, which benefits from a $7 million reduction to interest expense driven by a $225 million reduction to 2024 capital expenditures less prepaid rent additions.
| (in millions, except per share amounts) |
Full Year 2024 Outlook(a)(b) |
|
Changes to Midpoint from Previous Outlook(c) |
| Site rental billings(d) |
$5,740 |
to |
$5,780 |
|
$— |
| Amortization of prepaid rent |
$392 |
to |
$417 |
|
($18) |
| Straight-lined revenues |
$162 |
to |
$187 |
|
($13) |
| Site rental revenues |
$6,317 |
to |
$6,362 |
|
($30) |
| Site rental costs of operations(e) |
$1,686 |
to |
$1,731 |
|
$— |
| Services and other gross margin |
$65 |
to |
$95 |
|
$— |
| Net income (loss) |
$1,125 |
to |
$1,190 |
|
($95) |
| Net income (loss) per share—diluted |
$2.59 |
to |
$2.74 |
|
($0.21) |
| Adjusted EBITDA(f) |
$4,143 |
to |
$4,193 |
|
$5 |
| Depreciation, amortization and accretion |
$1,680 |
to |
$1,775 |
|
$— |
| Interest expense and amortization of deferred financing costs, net(g) |
$926 |
to |
$971 |
|
($7) |
| FFO(f) |
$2,863 |
to |
$2,893 |
|
($96) |
| AFFO(f) |
$3,005 |
to |
$3,055 |
|
$25 |
| AFFO per share(f) |
$6.91 |
to |
$7.02 |
|
$0.06 |
| Towers Segment discretionary capital expenditures(f) |
$180 |
to |
$180 |
|
$— |
| Fiber Segment discretionary capital expenditures(f) |
$1,050 |
to |
$1,150 |
|
($300) |
(a) As issued on June 11, 2024.
(b) Net income (loss) outlook, including on a per share basis, includes the benefit of contemplated cost reductions discussed above and potential charges associated with such cost reductions. Such restructuring charges are excluded from AFFO and Adjusted EBITDA.
(c) As issued on April 17, 2024.
(d) See "Non-GAAP Measures and Other Information" for our definition of site rental billings.
(e) Exclusive of depreciation, amortization and accretion.
(f) See "Non-GAAP Measures and Other Information" for further information and reconciliation of non-GAAP financial measures to net income (loss), including on a per share basis, and for definition of discretionary capital expenditures.
(g) See "Non-GAAP Measures and Other Information" for the reconciliation of "Outlook for Components of Interest Expense."
- The chart below reconciles the components contributing to expected 2024 growth in site rental revenues. Full year consolidated site rental billings growth, excluding the impact of Sprint Cancellations, is expected to be 5%, inclusive of 4.5% from towers, 15% from small cells, and 2% from fiber solutions.
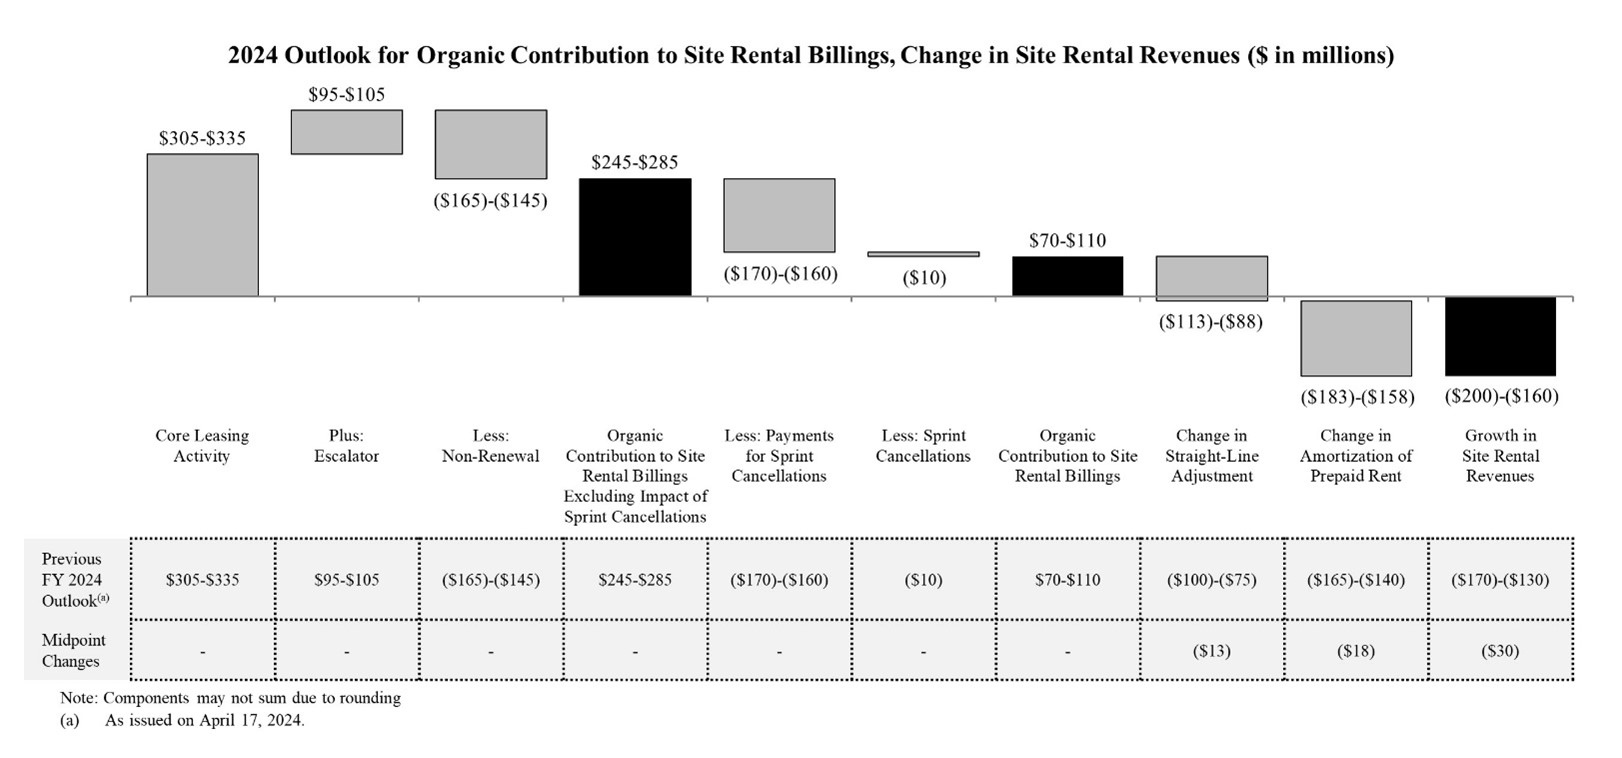
- In total, core leasing activity is expected to contribute $305 million to $335 million, comprised of $105 million to $115 million from towers (unchanged from the previous Outlook), $65 million to $75 million from small cells (compared to $55 million to $65 million in the previous Outlook) and $135 million to $145 million from fiber solutions (compared to $145 million to $155 million in the previous Outlook).
- Small cell core leasing is expected to increase by $10 million from the previous outlook, which includes a $15 million decrease from lower activity levels and project delays, more than offset by $25 million of higher-than-expected non-recurring revenues. Excluding the impact of Sprint Cancellations and the increase in non-recurring revenues, small cell organic growth is expected to be 10% in 2024, a reduction from the previous Outlook of 13% growth.
- Fiber solutions core leasing is expected to decrease by $10 million from the previous outlook in 2024 as Crown Castle transitions its sales strategy, resulting in expected organic growth of approximately 2% in the year, a reduction from the previous Outlook of 3% organic growth.
- The chart below reconciles the components contributing to the year over year change to 2024 AFFO.
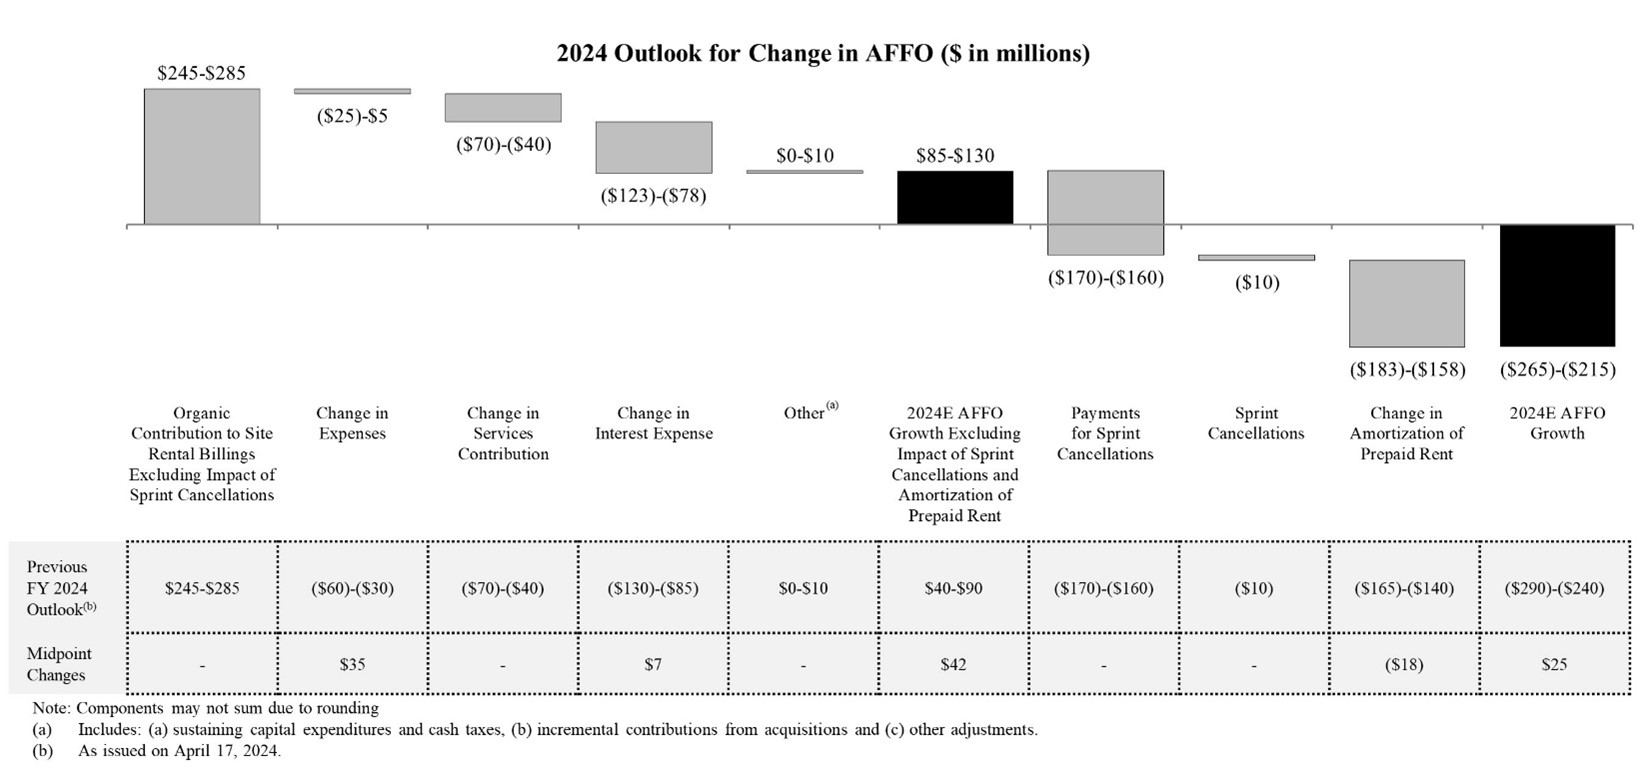
- Reduced staffing levels and office closures, which are associated with lower activity levels, are expected to generate approximately $100 million of run-rate cost savings, $60 million of which is expected to impact full year 2024. These savings are partially offset by $25 million of advisory fees primarily related to the recent proxy contest, resulting in a $35 million decrease to expenses compared to the previous Outlook.
- Lower capital spend resulting from our revised operating plan is expected to decrease interest expense by approximately $7 million compared to the previous Outlook.
- The full year 2024 Outlook for discretionary capital expenditures and prepaid rent additions has been updated to reflect lower expected activity in our Fiber segment. Discretionary capital expenditures are expected to be $1.2 billion to $1.3 billion, including approximately $1.1 billion in the Fiber segment and $180 million in the Towers segment, and prepaid rent additions are expected to be approximately $355 million in 2024, including $275 million from Fiber and $80 million from Towers.
ABOUT CROWN CASTLE
Crown Castle owns, operates and leases more than 40,000 cell towers and approximately 90,000 route miles of fiber supporting small cells and fiber solutions across every major U.S. market. This nationwide portfolio of communications infrastructure connects cities and communities to essential data, technology and wireless service - bringing information, ideas and innovations to the people and businesses that need them. For more information on Crown Castle, please visit www.crowncastle.com.
Non-GAAP Measures and Other Information
This press release includes presentations of Adjusted EBITDA, Adjusted Funds from Operations ("AFFO"), including per share amounts, Funds from Operations ("FFO"), including per share amounts, Organic Contribution to Site Rental Billings, including as Adjusted for Impact of Sprint Cancellations, which are non-GAAP financial measures. These non-GAAP financial measures are not intended as alternative measures of operating results or cash flow from operations (as determined in accordance with Generally Accepted Accounting Principles ("GAAP")). In addition, we provide the components of certain GAAP measures, such as site rental revenues and capital expenditures.
Our non-GAAP financial measures may not be comparable to similarly titled measures of other companies, including other companies in the communications infrastructure sector or other real estate investment trusts ("REITs").
Our non-GAAP financial measures are presented as additional information because management believes these measures are useful indicators of the financial performance of our business. Among other things, management believes that:
- Adjusted EBITDA is useful to investors or other interested parties in evaluating our financial performance. Adjusted EBITDA is the primary measure used by management (1) to evaluate the economic productivity of our operations and (2) for purposes of making decisions about allocating resources to, and assessing the performance of, our operations. Management believes that Adjusted EBITDA helps investors or other interested parties meaningfully evaluate and compare the results of our operations (1) from period to period and (2) to our competitors, by removing the impact of our capital structure (primarily interest charges from our outstanding debt) and asset base (primarily depreciation, amortization and accretion) from our financial results. Management also believes Adjusted EBITDA is frequently used by investors or other interested parties in the evaluation of the communications infrastructure sector and other REITs to measure financial performance without regard to items such as depreciation, amortization and accretion, which can vary depending upon accounting methods and the book value of assets. In addition, Adjusted EBITDA is similar to the measure of current financial performance generally used in our debt covenant calculations. Adjusted EBITDA should be considered only as a supplement to net income (loss) computed in accordance with GAAP as a measure of our performance.
- AFFO, including per share amounts, is useful to investors or other interested parties in evaluating our financial performance. Management believes that AFFO helps investors or other interested parties meaningfully evaluate our financial performance as it includes (1) the impact of our capital structure (primarily interest expense on our outstanding debt and dividends on our preferred stock (in periods where applicable)) and (2) sustaining capital expenditures, and excludes the impact of our (1) asset base (primarily depreciation, amortization and accretion) and (2) certain non-cash items, including straight-lined revenues and expenses related to fixed escalations and rent free periods. GAAP requires rental revenues and expenses related to leases that contain specified rental increases over the life of the lease to be recognized evenly over the life of the lease. In accordance with GAAP, if payment terms call for fixed escalations or rent free periods, the revenues or expenses are recognized on a straight-lined basis over the fixed, non-cancelable term of the contract. Management notes that Crown Castle uses AFFO only as a performance measure. AFFO should be considered only as a supplement to net income (loss) computed in accordance with GAAP as a measure of our performance and should not be considered as an alternative to cash flow from operations or as residual cash flow available for discretionary investment.
- FFO, including per share amounts, is useful to investors or other interested parties in evaluating our financial performance. Management believes that FFO may be used by investors or other interested parties as a basis to compare our financial performance with that of other REITs. FFO helps investors or other interested parties meaningfully evaluate financial performance by excluding the impact of our asset base (primarily real estate depreciation, amortization and accretion). FFO is not a key performance indicator used by Crown Castle. FFO should be considered only as a supplement to net income (loss) computed in accordance with GAAP as a measure of our performance and should not be considered as an alternative to cash flow from operations.
- Organic Contribution to Site Rental Billings is useful to investors or other interested parties in understanding the components of the year-over-year changes in our site rental revenues computed in accordance with GAAP. Management uses Organic Contribution to Site Rental Billings to assess year-over-year growth rates for our rental activities, to evaluate current performance, to capture trends in rental rates, core leasing activities and tenant non-renewals in our core business, as well as to forecast future results. Separately, we are also disclosing Organic Contribution to Site Rental Billings as Adjusted for Impact of Sprint Cancellations, which is outside of ordinary course, to provide further insight into our results of operations and underlying trends. Management believes that identifying the impact for Sprint Cancellations provides increased transparency and comparability across periods. Organic Contribution to Site Rental Billings (including as Adjusted for Impact of Sprint Cancellations) is not meant as an alternative measure of revenue and should be considered only as a supplement in understanding and assessing the performance of our site rental revenues computed in accordance with GAAP.
Non-GAAP Financial Measures
Adjusted EBITDA. We define Adjusted EBITDA as net income (loss) plus restructuring charges (credits), asset write-down charges, acquisition and integration costs, depreciation, amortization and accretion, amortization of prepaid lease purchase price adjustments, interest expense and amortization of deferred financing costs, net, (gains) losses on retirement of long-term obligations, net (gain) loss on interest rate swaps, (gains) losses on foreign currency swaps, impairment of available-for-sale securities, interest income, other (income) expense, (benefit) provision for income taxes, net (income) loss from discontinued operations, (gain) loss on sale of discontinued operations, cumulative effect of a change in accounting principle and stock-based compensation expense, net.
AFFO. We define AFFO as FFO before straight-lined revenues, straight-lined expenses, stock-based compensation expense, net, non-cash portion of tax provision, non-real estate related depreciation, amortization and accretion, amortization of non-cash interest expense, other (income) expense, (gains) losses on retirement of long-term obligations, net (gain) loss on interest rate swaps, (gains) losses on foreign currency swaps, impairment of available-for-sale securities, acquisition and integration costs, restructuring charges (credits), net (income) loss from discontinued operations, (gain) loss on sale of discontinued operations, cumulative effect of a change in accounting principle and adjustments for noncontrolling interests, less sustaining capital expenditures.
AFFO per share. We define AFFO per share as AFFO divided by diluted weighted-average common shares outstanding.
FFO. We define FFO as net income (loss) plus real estate related depreciation, amortization and accretion and asset write-down charges, less noncontrolling interest and cash paid for preferred stock dividends (in periods where applicable), and is a measure of funds from operations attributable to common stockholders.
FFO per share. We define FFO per share as FFO divided by diluted weighted-average common shares outstanding.
Organic Contribution to Site Rental Billings. We define Organic Contribution to Site Rental Billings as the sum of the change in site rental revenues related to core leasing activity, escalators and payments for Sprint Cancellations, less non-renewals of tenant contracts and non-renewals associated with Sprint Cancellations. Additionally, Organic Contribution to Site Rental Billings as Adjusted for Impact of Sprint Cancellations reflects Organic Contribution to Site Rental Billings less payments for Sprint Cancellations, plus non-renewals associated with Sprint Cancellations.
Other Definitions
Site rental billings. We define site rental billings as site rental revenues exclusive of the impacts from (1) straight-lined revenues, (2) amortization of prepaid rent in accordance with GAAP and (3) contribution from recent acquisitions until the one-year anniversary of such acquisitions.
Core leasing activity. We define core leasing activity as site rental revenues growth from tenant additions across our entire portfolio and renewals or extensions of tenant contracts, exclusive of (1) the impacts from both straight-lined revenues and amortization of prepaid rent in accordance with GAAP and (2) payments for Sprint Cancellations, where applicable.
Non-renewals. We define non-renewals of tenant contracts as the reduction in site rental revenues as a result of tenant churn, terminations and, in limited circumstances, reductions of existing lease rates, exclusive of non-renewals associated with Sprint Cancellations, where applicable.
Discretionary capital expenditures. We define discretionary capital expenditures as those capital expenditures made with respect to activities which we believe exhibit sufficient potential to enhance long-term stockholder value. They primarily consist of expansion or development of communications infrastructure (including capital expenditures related to (1) enhancing communications infrastructure in order to add new tenants for the first time or support subsequent tenant equipment augmentations or (2) modifying the structure of a communications infrastructure asset to accommodate additional tenants) and construction of new communications infrastructure. Discretionary capital expenditures also include purchases of land interests (which primarily relates to land assets under towers as we seek to manage our interests in the land beneath our towers), certain technology-related investments necessary to support and scale future customer demand for our communications infrastructure, and other capital projects.
Sustaining capital expenditures. We define sustaining capital expenditures as those capital expenditures not otherwise categorized as discretionary capital expenditures, such as (1) maintenance capital expenditures on our communications infrastructure assets that enable our tenants' ongoing quiet enjoyment of the communications infrastructure and (2) ordinary corporate capital expenditures.
Sprint Cancellations. We define Sprint Cancellations as lease cancellations related to the previously disclosed T-Mobile US, Inc. and Sprint network consolidation as described in our press release dated April 19, 2023.
Reconciliation of Historical Adjusted EBITDA:
|
|
For the Twelve Months Ended |
| (in millions; totals may not sum due to rounding) |
|
December 31, 2023 |
| Net income (loss) |
|
$ |
1,502 |
|
| Adjustments to increase (decrease) net income (loss): |
|
|
| Asset write-down charges |
|
|
33 |
|
| Acquisition and integration costs |
|
|
1 |
|
| Depreciation, amortization and accretion |
|
|
1,754 |
|
| Restructuring charges(a) |
|
|
85 |
|
| Amortization of prepaid lease purchase price adjustments |
|
|
16 |
|
| Interest expense and amortization of deferred financing costs, net |
|
|
850 |
|
| Interest income |
|
|
(15 |
) |
| Other (income) expense |
|
|
6 |
|
| (Benefit) provision for income taxes |
|
|
26 |
|
| Stock-based compensation expense, net |
|
|
157 |
|
| Adjusted EBITDA(b)(c) |
|
$ |
4,415 |
|
Reconciliation of Current Outlook for Adjusted EBITDA:
|
Full Year 2024 |
| (in millions; totals may not sum due to rounding) |
Outlook(f) |
| Net income (loss) |
$1,125 |
to |
$1,190 |
| Adjustments to increase (decrease) net income (loss): |
|
|
|
| Asset write-down charges |
$42 |
to |
$52 |
| Acquisition and integration costs |
$0 |
to |
$6 |
| Depreciation, amortization and accretion |
$1,680 |
to |
$1,775 |
| Restructuring charges(d) |
$100 |
to |
$130 |
| Amortization of prepaid lease purchase price adjustments |
$15 |
to |
$17 |
| Interest expense and amortization of deferred financing costs, net(e) |
$926 |
to |
$971 |
| (Gains) losses on retirement of long-term obligations |
— |
to |
— |
| Interest income |
$(12) |
to |
$(11) |
| Other (income) expense |
$0 |
to |
$9 |
| (Benefit) provision for income taxes |
$20 |
to |
$28 |
| Stock-based compensation expense, net |
$142 |
to |
$146 |
| Adjusted EBITDA(b)(c) |
$4,143 |
to |
$4,193 |
(a) Historical charges are related to the Company's restructuring plan announced in July 2023. For additional information see the Annual Report on Form 10-K for the fiscal year ended December 31, 2023.
(b) See discussion and our definition of Adjusted EBITDA in this "Non-GAAP Measures and Other Information."
(c) The above reconciliation excludes line items included in our definition which are not applicable for the periods shown.
(d) Represents restructuring charges stemming from the Company's restructuring plan announced in July 2023, as further discussed in the Annual Report on Form 10-K for the fiscal year ended December 31, 2023, and restructuring plan announced in June 2024, as further discussed in the Current Report on Form 8-K, filed on June 11, 2024.
(e) See the reconciliation of "Outlook for Components of Interest Expense" for a discussion of non-cash interest expense.
(f) As issued on June 11, 2024.
Reconciliation of Historical FFO and AFFO:
|
For the Twelve Months Ended |
| (in millions; totals may not sum due to rounding) |
December 31, 2023 |
| Net income (loss) |
$ |
1,502 |
|
| Real estate related depreciation, amortization and accretion |
|
1,692 |
|
| Asset write-down charges |
|
33 |
|
| FFO(a)(b) |
$ |
3,227 |
|
| Weighted-average common shares outstanding—diluted |
|
434 |
|
|
|
| FFO (from above) |
$ |
3,227 |
|
| Adjustments to increase (decrease) FFO: |
|
| Straight-lined revenues |
|
(274 |
) |
| Straight-lined expenses |
|
73 |
|
| Stock-based compensation expense, net |
|
157 |
|
| Non-cash portion of tax provision |
|
8 |
|
| Non-real estate related depreciation, amortization and accretion |
|
62 |
|
| Amortization of non-cash interest expense |
|
14 |
|
| Other (income) expense |
|
6 |
|
| Acquisition and integration costs |
|
1 |
|
| Restructuring charges(c) |
|
85 |
|
| Sustaining capital expenditures |
|
(83 |
) |
| AFFO(a)(b) |
$ |
3,277 |
|
| Weighted-average common shares outstanding—diluted |
|
434 |
|
(a) See discussion and our definitions of FFO and AFFO in this "Non-GAAP Measures and Other Information."
(b) The above reconciliation excludes line items included in our definition which are not applicable for the period shown.
(c) Historical charges are related to the Company's restructuring plan announced in July 2023. For additional information, see the Annual Report on Form 10-K for the fiscal year ended December 31, 2023.
Reconciliation of Historical FFO and AFFO per share:
|
For the Twelve Months Ended |
| (in millions, except per share amounts; totals may not sum due to rounding) |
December 31, 2023 |
| Net income (loss) |
$ |
3.46 |
|
| Real estate related depreciation, amortization and accretion |
|
3.90 |
|
| Asset write-down charges |
|
0.08 |
|
| FFO(a)(b) |
$ |
7.43 |
|
| Weighted-average common shares outstanding—diluted |
|
434 |
|
|
|
| FFO (from above) |
$ |
7.43 |
|
| Adjustments to increase (decrease) FFO: |
|
| Straight-lined revenues |
|
(0.63 |
) |
| Straight-lined expenses |
|
0.17 |
|
| Stock-based compensation expense, net |
|
0.36 |
|
| Non-cash portion of tax provision |
|
0.02 |
|
| Non-real estate related depreciation, amortization and accretion |
|
0.14 |
|
| Amortization of non-cash interest expense |
|
0.03 |
|
| Other (income) expense |
|
0.01 |
|
| Acquisition and integration costs |
|
— |
|
| Restructuring charges(c) |
|
0.20 |
|
| Sustaining capital expenditures |
|
(0.19 |
) |
| AFFO(a)(b) |
$ |
7.55 |
|
| Weighted-average common shares outstanding—diluted |
|
434 |
|
(a) See discussion and our definitions of FFO and AFFO, including per share amounts, in this "Non-GAAP Measures and Other Information."
(b) The above reconciliation excludes line items included in our definition which are not applicable for the period shown.
(c) Historical charges are related to the Company's restructuring plan announced in July 2023. For additional information, see the Annual Report on Form 10-K for the fiscal year ended December 31, 2023.
Reconciliation of Current Outlook for FFO and AFFO:
|
Full Year 2024 |
|
Full Year 2024 |
| (in millions, except per share amounts; totals may not sum due to rounding) |
Outlook(a) |
|
Outlook per share(a) |
| Net income (loss) |
$1,125 |
to |
$1,190 |
|
$2.59 |
to |
$2.74 |
| Real estate related depreciation, amortization and accretion |
$1,634 |
to |
$1,714 |
|
$3.76 |
to |
$3.94 |
| Asset write-down charges |
$42 |
to |
$52 |
|
$0.10 |
to |
$0.12 |
| FFO(b)(c) |
$2,863 |
to |
$2,893 |
|
$6.58 |
to |
$6.65 |
| Weighted-average common shares outstanding—diluted |
435 |
|
435 |
|
|
|
|
|
|
|
|
| FFO (from above) |
$2,863 |
to |
$2,893 |
|
$6.58 |
to |
$6.65 |
| Adjustments to increase (decrease) FFO: |
|
|
|
|
|
|
|
| Straight-lined revenues |
$(187) |
to |
$(162) |
|
$(0.43) |
to |
$(0.37) |
| Straight-lined expenses |
$55 |
to |
$75 |
|
$0.13 |
to |
$0.17 |
| Stock-based compensation expense, net |
$142 |
to |
$146 |
|
$0.33 |
to |
$0.34 |
| Non-cash portion of tax provision |
$2 |
to |
$17 |
|
$0.00 |
to |
$0.04 |
| Non-real estate related depreciation, amortization and accretion |
$46 |
to |
$61 |
|
$0.11 |
to |
$0.14 |
| Amortization of non-cash interest expense |
$9 |
to |
$19 |
|
$0.02 |
to |
$0.04 |
| Other (income) expense |
$0 |
to |
$9 |
|
$0.00 |
to |
$0.02 |
| (Gains) losses on retirement of long-term obligations |
— |
to |
— |
|
$0.00 |
to |
$0.00 |
| Acquisition and integration costs |
$0 |
to |
$6 |
|
$0.00 |
to |
$0.01 |
| Restructuring charges(d) |
$100 |
to |
$130 |
|
$0.23 |
to |
$0.30 |
| Sustaining capital expenditures |
$(85) |
to |
$(65) |
|
$(0.20) |
to |
$(0.15) |
| AFFO(b)(c) |
$3,005 |
to |
$3,055 |
|
$6.91 |
to |
$7.02 |
| Weighted-average common shares outstanding—diluted |
435 |
|
435 |
(a) As issued on June 11, 2024.
(b) See discussion and our definitions of FFO and AFFO, including per share amounts, in this "Non-GAAP Measures and Other Information."
(c) The above reconciliation excludes line items included in our definition which are not applicable for the periods shown.
(d) Represents restructuring charges stemming from the Company's restructuring plan announced in July 2023, as further discussed in the Annual Report on Form 10-K for the fiscal year ended December 31, 2023, and restructuring plan announced in June 2024, as further discussed in the Current Report on Form 8-K, filed on June 11, 2024.
For Comparative Purposes - Reconciliation of Previous Outlook for Adjusted EBITDA:
|
Previously Issued |
| (in millions; totals may not sum due to rounding) |
Full Year 2024 Outlook(a) |
| Net income (loss) |
$1,213 |
to |
$1,293 |
| Adjustments to increase (decrease) income (loss) from continuing operations: |
|
|
|
| Asset write-down charges |
$42 |
to |
$52 |
| Acquisition and integration costs |
$0 |
to |
$6 |
| Depreciation, amortization and accretion |
$1,680 |
to |
$1,775 |
| Restructuring charges(b) |
$0 |
to |
$15 |
| Amortization of prepaid lease purchase price adjustments |
$15 |
to |
$17 |
| Interest expense and amortization of deferred financing costs, net(c) |
$933 |
to |
$978 |
| (Gains) losses on retirement of long-term obligations |
— |
to |
— |
| Interest income |
$(12) |
to |
$(11) |
| Other (income) expense |
$0 |
to |
$9 |
| (Benefit) provision for income taxes |
$20 |
to |
$28 |
| Stock-based compensation expense, net |
$142 |
to |
$146 |
| Adjusted EBITDA(d)(e) |
$4,138 |
to |
$4,188 |
For Comparative Purposes - Reconciliation of Previous Outlook for FFO and AFFO:
|
Previously Issued |
|
Previously Issued |
| (in millions, except per share amounts; totals may not sum due to rounding) |
Full Year 2024
Outlook(a) |
|
Full Year 2024 Outlook
per share(a) |
| Net income (loss) |
$1,213 |
to |
$1,293 |
|
$2.79 |
to |
$2.97 |
| Real estate related depreciation, amortization and accretion |
$1,634 |
to |
$1,714 |
|
$3.76 |
to |
$3.94 |
| Asset write-down charges |
$42 |
to |
$52 |
|
$0.10 |
to |
$0.12 |
| FFO(d)(e) |
$2,951 |
to |
$2,996 |
|
$6.78 |
to |
$6.89 |
| Weighted-average common shares outstanding—diluted |
435 |
|
435 |
|
|
|
|
|
|
|
|
| FFO (from above) |
$2,951 |
to |
$2,996 |
|
$6.78 |
to |
$6.89 |
| Adjustments to increase (decrease) FFO: |
|
|
|
|
|
|
|
| Straight-lined revenues |
$(197) |
to |
$(177) |
|
$(0.45) |
to |
$(0.41) |
| Straight-lined expenses |
$55 |
to |
$75 |
|
$0.13 |
to |
$0.17 |
| Stock-based compensation expense, net |
$142 |
to |
$146 |
|
$0.33 |
to |
$0.34 |
| Non-cash portion of tax provision |
$2 |
to |
$17 |
|
$0.00 |
to |
$0.04 |
| Non-real estate related depreciation, amortization and accretion |
$46 |
to |
$61 |
|
$0.11 |
to |
$0.14 |
| Amortization of non-cash interest expense |
$9 |
to |
$19 |
|
$0.02 |
to |
$0.04 |
| Other (income) expense |
$0 |
to |
$9 |
|
$0.00 |
to |
$0.02 |
| (Gains) losses on retirement of long-term obligations |
— |
to |
— |
|
— |
to |
— |
| Acquisition and integration costs |
$0 |
to |
$6 |
|
$0.00 |
to |
$0.01 |
| Restructuring charges(b) |
$0 |
to |
$15 |
|
$0.00 |
to |
$0.03 |
| Sustaining capital expenditures |
$(85) |
to |
$(65) |
|
$(0.20) |
to |
$(0.15) |
| AFFO(d)(e) |
$2,980 |
to |
$3,030 |
|
$6.85 |
to |
$6.97 |
| Weighted-average common shares outstanding—diluted |
435 |
|
435 |
(a) As issued on April 17, 2024.
(b) Previously issued full year 2024 Outlook reflects charges related to the Company's restructuring plan announced in July 2023. For additional information, see the Annual Report on Form 10-K for the fiscal year ended December 31, 2023.
(c) See the reconciliation of "Outlook for Components of Interest Expense" for a discussion of non-cash interest expense.
(d) See discussion of and our definition of Adjusted EBITDA, FFO and AFFO, including per share amounts in this "Non-GAAP Measures and Other Information."
(e) The above reconciliation excludes line items included in our definition which are not applicable for the periods shown.
Components of Changes in Site Rental Revenues for Full Year 2024 Outlook and Previous Full Year 2024 Outlook:
| (dollars in millions; totals may not sum due to rounding) |
Current Full Year 2024 Outlook(a) |
|
Previously Issued Full Year 2024 Outlook(b) |
| Components of changes in site rental revenues: |
|
|
|
| Prior year site rental billings excluding payments for Sprint Cancellations(c) |
$5,505 |
|
$5,505 |
| Prior year payments for Sprint Cancellations(c)(d) |
$170 |
|
$170 |
| Prior year site rental billings(c) |
$5,675 |
|
$5,675 |
|
|
|
|
| Core leasing activity(c) |
$305 |
|
to |
$335 |
|
$305 |
|
to |
$335 |
| Escalators |
$95 |
|
to |
$105 |
|
$95 |
|
to |
$105 |
| Non-renewals(c) |
$(165) |
|
to |
$(145) |
|
$(165) |
|
to |
$(145) |
| Organic Contribution to Site Rental Billings as Adjusted for Impact of Sprint Cancellations(c) |
$245 |
|
to |
$285 |
|
$245 |
|
to |
$285 |
| Payments for Sprint Cancellations(c)(d) |
$(170) |
|
to |
$(160) |
|
$(170) |
|
to |
$(160) |
| Non-renewals associated with Sprint Cancellations(c)(d) |
$(10) |
|
to |
$(10) |
|
$(10) |
|
to |
$(10) |
| Organic Contribution to Site Rental Billings(c) |
$70 |
|
to |
$110 |
|
$70 |
|
to |
$110 |
| Straight-lined revenues |
$162 |
|
to |
$187 |
|
$175 |
|
to |
$200 |
| Amortization of prepaid rent |
$392 |
|
to |
$417 |
|
$410 |
|
to |
$435 |
| Acquisitions(e) |
— |
|
— |
| Total site rental revenues |
$6,317 |
|
to |
$6,362 |
|
$6,347 |
|
to |
$6,392 |
|
|
|
|
| Year-over-year changes in revenues:(f) |
|
|
|
| Site rental revenues |
(3.0)% |
|
(2.5)% |
| Changes in revenues as a percentage of prior year site rental billings: |
|
|
|
| Organic Contribution to Site Rental Billings as Adjusted for Impact of Sprint Cancellations(c) |
4.8% |
|
4.8% |
| Organic Contribution to Site Rental Billings(c) |
1.6% |
|
1.6% |
(a) As issued on June 11, 2024.
(b) As issued on April 17, 2024.
(c) See our definitions of site rental billings, core leasing activity, non-renewals, Sprint Cancellations, Organic Contribution to Site Rental Billings, and Organic Contribution to Site Rental Billings as Adjusted for Impact of Sprint Cancellations in this "Non-GAAP Measures and Other Information."
(d) In 2023, we received $104 million and $66 million of payments for Sprint Cancellations that related to small cells and fiber solutions, respectively. There were $14 million and $7 million of non-renewals associated with Sprint Cancellations that related to small cells and fiber solutions, respectively, in 2023. These payments are non-recurring and therefore reduce full year 2024 Organic Contribution to Site Rental Billings by the same amount.
(e) Represents the contribution from recent acquisitions. The financial impact of recent acquisitions is excluded from Organic Contribution to Site Rental Billings, including as Adjusted for Impact of Sprint Cancellations, until the one-year anniversary of such acquisitions.
(f) Calculated based on midpoint of full year 2024 Outlook, where applicable.
Components of Capital Expenditures:(a)
|
For the Twelve Months Ended |
|
December 31, 2023 |
| (in millions) |
Towers |
Fiber |
Other |
Total |
| Discretionary capital expenditures: |
|
|
|
|
| Communications infrastructure improvements and other capital projects |
$ |
122 |
$ |
1,131 |
$ |
24 |
$ |
1,277 |
| Purchases of land interests |
|
64 |
|
— |
|
— |
|
64 |
| Sustaining capital expenditures |
|
8 |
|
44 |
|
31 |
|
83 |
| Total capital expenditures |
$ |
194 |
$ |
1,175 |
$ |
55 |
$ |
1,424 |
Discretionary Capital Expenditures Less Prepaid Rent Additions for Full Year 2023 and Current and Previous Outlook for Full Year 2024:(b)
| (in millions) |
Full Year 2023 |
|
Full Year 2024 Outlook(c) |
|
Previous Full Year 2024 Outlook(d) |
| Discretionary capital expenditures |
$1,341 |
|
$1,230 |
to |
$1,330 |
|
$1,530 |
to |
$1,630 |
| Less: Prepaid rent additions(e) |
$348 |
|
~$355 |
|
~$430 |
| Discretionary capital expenditures less prepaid rent additions |
$993 |
|
$875 |
to |
$975 |
|
$1,100 |
to |
$1,200 |
Outlook for Components of Interest Expense:
| (in millions) |
Full Year 2024 Outlook(c) |
|
Previous Full Year 2024 Outlook(d) |
| Interest expense on debt obligations |
$915 |
to |
$955 |
|
$922 |
to |
$962 |
| Amortization of deferred financing costs and adjustments on long-term debt |
$20 |
to |
$30 |
|
$20 |
to |
$30 |
| Capitalized interest |
$(17) |
to |
$(7) |
|
$(17) |
to |
$(7) |
| Interest expense and amortization of deferred financing costs, net |
$926 |
to |
$971 |
|
$933 |
to |
$978 |
(a) See our definitions of discretionary capital expenditures and sustaining capital expenditures in this "Non-GAAP Measures and Other Information."
(b) Excludes sustaining capital expenditures. See "Non-GAAP Measures and Other Information" for our definitions of discretionary capital expenditures and sustaining capital expenditures.
(c) As issued on June 11, 2024.
(d) As issued on April 17, 2024.
(e) Reflects up-front consideration from long-term tenant contracts (commonly referred to as prepaid rent) that are amortized and recognized as revenue over the associated estimated lease term in accordance with GAAP.
Cautionary Language Regarding Forward-Looking Statements
This news release contains forward-looking statements and information that are based on Crown Castle management's current expectations as of the date of this news release. Statements that are not historical facts are hereby identified as forward-looking statements. In addition, words such as "estimate," "see," "anticipate," "project," "plan," "intend," "believe," "expect," "likely," "predicted," "positioned," "continue," "target," "focus," and any variations of these words and similar expressions are intended to identify forward-looking statements. Such statements include our full year 2024 Outlook and plans, projections, expectations and estimates regarding (1) Crown Castle's strategy, including with respect to fiber solutions and small cells investments, and the demand for its communications infrastructure, (2) revenue growth, including with respect to fiber solutions and small cells, and its driving factors, (3) net income (loss) (including on a per share basis), (4) AFFO (including on a per share basis) and its components and growth, (5) Adjusted EBITDA and its components and growth, (6) Organic Contribution to Site Rental Billings (including as Adjusted for Impact of Sprint Cancellations) and its components and growth, (7) site rental revenues and its components and growth, (8) interest expense, (9) the impact of Sprint Cancellations on Crown Castle's operating and financial results, (10) implementation of the operational changes, including the restructuring plan, and the timing, scope, extent, benefits and sustainability thereof, (11) the growth in Crown Castle's business and its driving factors, (12) discretionary capital expenditures, including the effectiveness and efficiency of changes thereto, (13) prepaid rent additions and amortization, (14) leasing activity, (15) site rental billings, (16) fiber strategic review and the potential impacts and benefits therefrom, (17) operating cost reductions, including cost savings and other resulting benefits, (18) reliance on external capital, (19) fiber solutions and small cells opportunities, and growth, and (20) small cells backlog and deployment.
Such forward-looking statements are subject to certain risks, uncertainties and assumptions, including prevailing market conditions and the following:
- Our business depends on the demand for our communications infrastructure (including towers, small cells and fiber), driven primarily by demand for data, and we may be adversely affected by any slowdown in such demand. Additionally, a reduction in the amount or change in the mix of network investment by our tenants may materially and adversely affect our business (including reducing demand for our communications infrastructure or services).
- A substantial portion of our revenues is derived from a small number of tenants, and the loss, consolidation or financial instability of any of such tenants may materially decrease revenues, reduce demand for our communications infrastructure and services and impact our dividend per share growth.
- The expansion or development of our business, including through acquisitions, increased product offerings or other strategic opportunities, may cause disruptions in our business, which may have an adverse effect on our business, operations or financial results.
- Our Fiber segment has expanded, and the Fiber business model contains certain differences from our Towers business model, resulting in different operational risks. If we do not successfully operate our Fiber business model or identify or manage the related operational risks, such operations may produce results that are lower than anticipated.
- Our review of potential strategic alternatives may not result in an executed or consummated transaction or other strategic alternative, and the process of reviewing strategic alternatives or the outcome could adversely affect our business. There is no guarantee that any transaction resulting from the strategic review will ultimately benefit our shareholders.
- Failure to timely, efficiently and safely execute on our construction projects could adversely affect our business.
- New technologies may reduce demand for our communications infrastructure or negatively impact our revenues.
- If we fail to retain rights to our communications infrastructure, including the rights to land under our towers and the right-of-way and other agreements related to our small cells and fiber, our business may be adversely affected.
- Our services business has historically experienced significant volatility in demand, which reduces the predictability of our results.
- If radio frequency emissions from wireless handsets or equipment on our communications infrastructure are demonstrated to cause negative health effects, potential future claims could adversely affect our operations, costs or revenues.
- Cybersecurity breaches or other information technology disruptions could adversely affect our operations, business, and reputation.
- Our business may be adversely impacted by climate-related events, natural disasters, including wildfires, and other unforeseen events.
- As a result of competition in our industry, we may find it more difficult to negotiate favorable rates on our new or renewing tenant contracts.
- New wireless technologies may not deploy or be adopted by tenants as rapidly or in the manner projected.
- Our focus on and disclosure of our Environmental, Social and Governance position, metrics, strategy, goals and initiatives expose us to potential litigation and other adverse effects to our business.
- Failure to attract, recruit and retain qualified and experienced employees could adversely affect our business, operations and costs.
- Changes to management, including turnover of our top executives, could have an adverse effect on our business.
- Actions that we are taking to restructure our business in alignment with our strategic priorities may not be as effective as anticipated.
- Actions of activist stockholders could impact the pursuit of our business strategies and adversely affect our results of operations, financial condition, or stock price.
- Our substantial level of indebtedness could adversely affect our ability to react to changes in our business, and the terms of our debt instruments limit our ability to take a number of actions that our management might otherwise believe to be in our best interests. In addition, if we fail to comply with our covenants, our debt could be accelerated.
- We have a substantial amount of indebtedness. In the event we do not repay or refinance such indebtedness, we could face substantial liquidity issues and might be required to issue equity securities or securities convertible into equity securities, or sell some of our assets, possibly on unfavorable terms, to meet our debt payment obligations.
- Sales or issuances of a substantial number of shares of our common stock or securities convertible into shares of our common stock may adversely affect the market price of our common stock.
- Certain provisions of our restated certificate of incorporation amended and restated by-laws and operative agreements, and domestic and international competition laws may make it more difficult for a third party to acquire control of us or for us to acquire control of a third party, even if such a change in control would be beneficial to our stockholders.
- If we fail to comply with laws or regulations which regulate our business and which may change at any time, we may be fined or even lose our right to conduct some of our business.
- Future dividend payments to our stockholders will reduce the availability of our cash on hand available to fund future discretionary investments, and may result in a need to incur indebtedness or issue equity securities to fund growth opportunities. In such event, the then current economic, credit market or equity market conditions will impact the availability or cost of such financing, which may hinder our ability to grow our per share results of operations.
- Remaining qualified to be taxed as a Real Estate Investment Trust ("REIT") involves highly technical and complex provisions of the Code. Failure to remain qualified as a REIT would result in our inability to deduct dividends to stockholders when computing our taxable income, thereby increasing our tax obligations and reducing our available cash.
- Complying with REIT requirements, including the 90% distribution requirement, may limit our flexibility or cause us to forgo otherwise attractive opportunities, including certain discretionary investments and potential financing alternatives.
- REIT related ownership limitations and transfer restrictions may prevent or restrict certain transfers of our capital stock.
Should one or more of these or other risks or uncertainties materialize, or should underlying assumptions prove incorrect, actual results may vary materially from those expected. More information about potential risk factors which could affect our results is included in our filings with the SEC. Our filings with the SEC are available through the SEC website at www.sec.gov or through our investor relations website at investor.crowncastle.com. We use our investor relations website to disclose information about us that may be deemed to be material. We encourage investors, the media and others interested in us to visit our investor relations website from time to time to review up-to-date information or to sign up for e-mail alerts to be notified when new or updated information is posted on the site.
As used in this release, the term "including," and any variation thereof, means "including without limitation."
|
Contacts: Dan Schlanger, CFO |
|
Kris Hinson, VP Corp Finance & Treasurer |
|
Crown Castle Inc. |
|
713-570-3050 |
Photos accompanying this announcement are available at
https://www.globenewswire.com/NewsRoom/AttachmentNg/b158c350-e307-4a04-82fc-949177bdc256
https://www.globenewswire.com/NewsRoom/AttachmentNg/fc3b1796-aca7-445d-969d-1a2cf87f9e0b