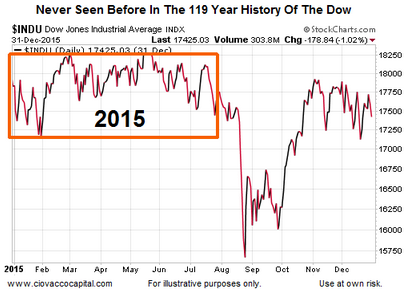
The Dow Jones Industrial Average was first calculated on May 26, 1896. Therefore the index has been around for over 119 years. With the Federal Reserve talking about raising interest rates for the first time in over nine years in 2015, the Dow moved in an indecisive and unprecedented manner between January 1, 2015 and July 24, 2015. From CNBC:
“On Thursday, the Dow Jones Industrial Average swung to a negative year-to-date return, the 21st such time it has moved to either side of breakeven for 2015. No other year has been so fickle, the closest being the 20 times the blue chip index swung in both 1934 and 1994, according to research compiled by Bespoke Investment Group.”
The List Of Rare Occurrences Is Long
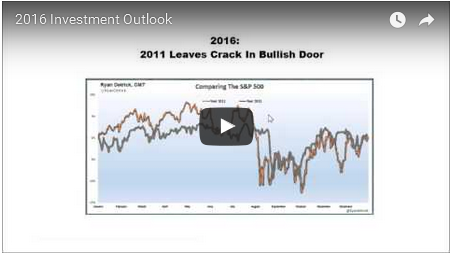
This week’s 2015 recap and 2016 investment outlook video covers numerous rare financial market occurrences. The video also covers:
- Major investment scenarios based on Fed policy (4:42 mark).
- Investment performance when interest rates have risen from historically low levels (1954-1968) (6:32).
- Similarities between 2015-2016 and 1986, 1994, 2000, and 2007 (9:04).
- Blue-chip and ETF performance in 2015 (17:47).
- High yield bonds and the S&P 500 (28:19).
- Money supply and the S&P 500 (29:17)
After you click play, use the button in the lower-right corner of the video player to view in
full-screen mode. Hit Esc to exit full-screen mode.

Breaking The Market’s Malaise
When markets are showing inflection point characteristics as they are today, often the big move (up or down) is triggered by something new to the markets. If the current sideways malaise is due to break to the downside, it is possible news from China, Iran, and/or Saudi Arabia could act as a bearish catalyst. From The Wall Street Journal:
“Weaker-than-expected manufacturing data and a falling currency triggered a 7% fall in mainland Chinese stocks that led authorities to halt trading there for the rest of the day.
Meanwhile, rising tensions in the Middle East led to volatility in oil prices, offering a further glimpse of the themes investors say are likely to influence markets this year.”
If the break is to the upside, it could be based on better than expected economic outcomes in 2016. From MarketWatch:
“The Federal Reserve could raise interest rates as many as five times this year, said San Francisco Fed President John Williams, on Monday…. Williams said the U.S. economy is ‘in very good shape’ and remains stronger than other major global economies. The economy is on pace to have continue job gains in 2016 after adding an estimated 2.5 million jobs last year, he said.”
Investment Implications – The Weight Of The Evidence
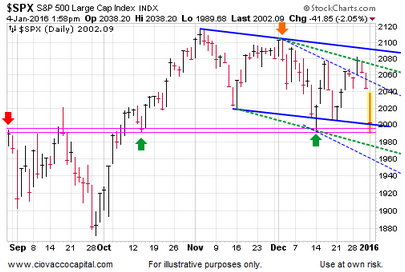
As noted on December 27, the hard data tracked by our market model has a bull/bear inflection point look as we head into 2016. An inflection point implies the possibility of a big move, either up or down. However, before a big move can occur in stocks, the S&P 500 would first need to break from the trading range established in early October 2015. Better information from a bearish perspective would come if the S&P 500 makes a sustained push below 1960.

This entry was posted on Monday, January 4th, 2016 at 2:32 pm and is filed under Stocks - U.S.. You can follow any responses to this entry through the RSS 2.0 feed. Both comments and pings are currently closed.
Copyright © 2014 Ciovacco Capital Management, LLC. All Rights Reserved. Chris Ciovacco is the Chief Investment Officer for Ciovacco Capital Management, LLC (CCM). Terms of Use. This article contains the current opinions of the author but not necessarily those of CCM. The opinions are subject to change without notice. This article is distributed for informational purposes only and should not be considered as investment advice or a recommendation of any particular security, strategy or investment product. The charts and comments are not recommendations to buy or sell any security. Market sectors and related ETFs are selected based on his opinion as to their importance in providing the viewer a comprehensive summary of market conditions for the featured period. Chart annotations are not predictive of any future market action rather they only demonstrate the opinion of the author as to a range of possibilities going forward. All material presented herein is believed to be reliable but we cannot attest to its accuracy. The information contained herein (including historical prices or values) has been obtained from sources that Ciovacco Capital Management (CCM) considers to be reliable; however, CCM makes no representation as to, or accepts any responsibility or liability for, the accuracy or completeness of the information contained herein or any decision made or action taken by you or any third party in reliance upon the data. Some results are derived using historical estimations from available data. Investment recommendations may change and readers are urged to check with tax and investment advisors before making any investment decisions. Opinions expressed in these reports may change without prior notice. This memorandum is based on information available to the public. No representation is made that it is accurate or complete. This memorandum is not an offer to buy or sell or a solicitation of an offer to buy or sell the securities mentioned. The investments discussed in this report may be unsuitable for investors depending on their specific investment objectives and financial position. Past performance is not necessarily a guide to future performance. The price or value of the investments to which this report relates, either directly or indirectly, may fall or rise against the interest of investors. All prices and yields contained in this report are subject to change without notice. This information is based on hypothetical assumptions and is intended for illustrative purposes only. PAST PERFORMANCE DOES NOT GUARANTEE FUTURE RESULTS. CCM would like to thank StockCharts.com for helping Short Takes create great looking charts Short Takes is proudly powered by WordPress . Entries (RSS)