Posted byMark Young
Jan 18, 2016 11:05:08 AM
M&A in the upstream sector of the Canadian oil and gas industry saw a very significant drop off from 2014, according to new analysis from CanOils. In 2015, the total combined value for all deals in Canada reached just over Cdn$21 billion, almost half of the 2014 total of Cdn$41 billion. The collapse in oil price has clearly been a major contributing factor to this. 2015 has been a year that has seen cash-rich companies attempt to buy assets at opportunistic price levels from struggling companies, while the potential targets in these deals are reluctant to sell assets at these new lower prices. This dynamic has created an impasse in many cases between buyers and sellers, hence the fall in M&A activity.

Source: CanOils M&A Database (see notes 1 and 2)
While the 2015 total is not the lowest overall total in recent years, the Cdn$21 billion is bolstered heavily by deals costing over Cdn$1 billion. There were four such deals in Canada in 2015 and together they made up 62% of the Cdn$21 billion total. In fact, the biggest deal of the year, the Cdn$6.6 billion offer made by Suncor Energy for its Syncrude partner Canadian Oil Sands Ltd., made up around 31% of the Cdn$21 billion total by itself.
If deals or offers with prices of over Cdn$1 billion are excluded from the chart above and deals with values of under this amount are considered independently, then 2015 did see the lowest activity in the last six years. This is similar to the U.S. shale industry, which saw a six-year low in total deal value in 2015 and only one deal with a value over US$1 billion.
Royalty Assets in Vogue
While there was a clear fall in activity in Canadian upstream M&A from 2014 to 2015, there is one asset type that has actually become relatively hot property. Royalty assets have been changing hands frequently and often for large sums since September 2014, when the price collapse began, particularly when compared to similar activity in the 4-5 year period prior to this.

Source: CanOils M&A Database
Selling royalty assets has clearly become a trend in the last eighteen months. The long-term nature of the titles, the lack of short-term risk and the low ongoing costs inherent to royalty assets have all meant that their value has not been as affected by low commodity prices as other asset types; they have served as a prudent strategy to raise capital during the price downturn. Notable royalty deals in 2015 have included Cenovus’ sale of 4.8 million acres for Cdn$3.3 billion in June, Canadian Natural Resources’ sale of its royalty business to PrairieSky Royalty Ltd. for Cdn1.8 billion in November and Penn West Petroleum’s sale of 325,000 acres for Cdn$318 million in April.
Deal Counts Show True Drop in Canadian M&A Activity
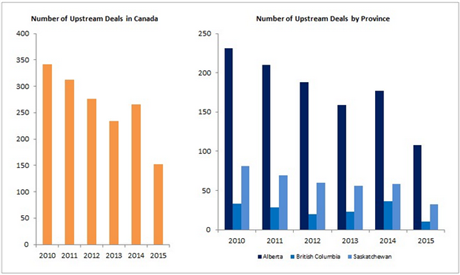
The fall in activity between 2015 and 2014 is much clearer if the number of deals announced is considered, rather than value. In fact, 2015 saw the lowest number of deals recorded in any of the six years since 2010. This lack of activity was not confined to any one particular geographic area either, with all three major producing Canadian provinces seeing significant drops in the number of new deals announced during 2015 compared to 2014.

Source: CanOils M&A Database (see notes 2 and 3)
Top 10 Deals Announced in Canada in 2015

Source: CanOils M&A Database (see note 1)
Notes
1) This includes deals that are still in progress but does not include deals that have been cancelled or bids that have been rejected. For any deal that is still in progress or incidences where an offer is still on the table, there is of course no guarantee of completion. In six months’ time, for instance, this chart could look completely different should a raft of deals be eventually cancelled for any reason.
2) A deal is assigned to each year based on its announcement date, unless the announcement was made in a later period to the actual deal taking place. For example, if a deal was announced in 2014, but did not complete until 2015, it would form part of the 2014 deal total. If, however, a deal was announced by a company in 2015, but actually closed in 2014, it would form part of the 2014 deal total.
3) A deal is assigned to a province if the deal involves assets within that province. If a deal involves assets from multiple provinces, it is included in the chart twice so that a province does not lose a deal in any case, even if it is a minor part of the deal in question. For example, if a deal involved assets from both Alberta and Saskatchewan, the count was included in both Alberta and Saskatchewan columns. The chart on the right (by province) is not indicative of the number of deals across the whole of Canada in each year because of this.