It is becoming increasingly evident that we are sitting on a near-term top for the S&P 500, and that the market has been confused by the earning results. Some examples:
* Apple (NASDQ: AAPL) showed it no longer is a growth company when it missed on earnings and predicted no growth in both revenue and earnings, yet the market closed up.
* Facebook (NASDQ:FB) beat by 30%, but the market dropped.
* First Solar (NASDQ:FSLR) beat by a whopping 82% and the share price shed 8%, while the market went up.
Maybe the air is too thin up here at these heights and investors are becoming disoriented. In any case, there is a disconnect between the market and fundamental reality; the near straight-line ascent of the market since the first week in February is not being justified by business activity.
There is an argument to be made that the correction at the start of the year was itself disconnected from fundamental reality, and that the subsequent rally was just the equalizer. But it can also be argued that now that the market has recovered, there is no reason for it to be valued at new highs, and perhaps its recovery was over-done and lower prices are now in order.
The various species of central banks around the World are certainly not helping to clear-up the confused state of the markets. The Bank of Japan (BOJ) had been signalling, through negative policy rates, that it was in favor of increasing stimulus by going even more negative with rates, or by increasing ETF purchases. It did neither, and that caused a flight into the Yen as a consequence.
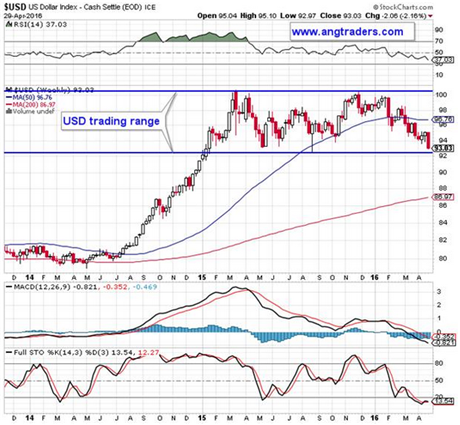
The FED has been unable (or unwilling) to tell the market when its next rate hike might materialize, and this has only added to the confusion. After spending all of 2015 telegraphing their intention to hike rates, the FED now can’t say if or when they will continue on the normalizing road, and this has caused the market to react as if rates had actually been cut. Not tightening the thumb-screws is not the same as loosening them, yet the Dollar has been behaving as if rates are being cut; trading lower against other currencies even though the other currencies really are cutting rates (down to the negative). Now that the BOJ has not cut, the dollar gets pushed down even further.

This type of confused reaction may be about to change. The market may come to remember that the FED actually raised rates already and is likely to raise them again at least once this year (the CME FED tool (
https://www.cmegroup.com/trading/interest-rates/countdown-to-fomc.html) gives a 65% chance of AT LEAST one hike). The greatest certitude lies in the fact that the FED will NOT be cutting rates this year. Without cutting rates, the dollar should bounce off of its lower boundary and head back up and, at the same time, the market should carve-out a top as it corrects. Probabilities don’t always become reality, however.
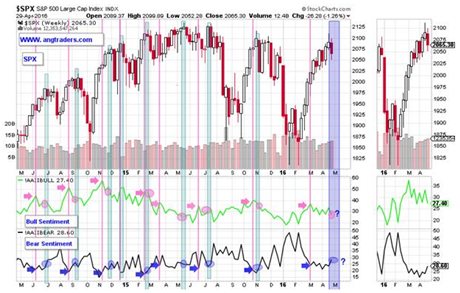
Last week we presented a pattern in the Bull and Bear Sentiment indicators that is highly predictive of topping formations. At the time, we pointed out that for this pattern to signal a top, the Bear indicator would have to INCREASE to a level above the spike. This has now occurred and on the chart below you can see that the Bear sentiment (blue circle with a question mark) is above the down-spike (blue arrow just to the left).

The Bull Sentiment also strengthened its pattern as its value (pink circle with a question mark) is below the up-spike value (pink arrow to the left). This looks like the slight fear that creeps in at market tops.
In conclusion, there are definitely reasons to expect a correction, but like always these are probabilities, not prescience.
Ang Traders
Join us at
www.angtraders.com and replicate our trades and profits.