Impairments and write-downs in the U.S. oil and gas industry were brought right back into focus by ExxonMobil’s admission (https://www.nytimes.com/2016/10/29/business/energy-environment/exxon-concedes-it-may-need-to-declare-lower-value-for-oil-in-ground.html?rref=collection%2Ftimestopic%2FCanada&_r=1) in October 2016 that it might have to write-down the value of some of its E&P assets around the world.
ExxonMobil, in what would be a significant change in accounting policy, may soon officially concede that 3.6 billion barrels of oil-sand reserves in Canada and one billion barrels of other North American reserves are currently not profitable to produce, according to the NY Times.
This would probably be the largest E&P impairment across the entire U.S. industry in 2016, but ExxonMobil would by no means be alone in declaring asset write-downs.
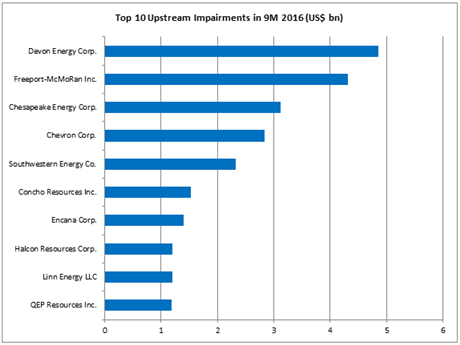
Over the year so far, looking at the most recent year-to-date nine monthly results for U.S.-listed companies in Evaluate Energy (https://www.evaluateenergy.com/) , Devon Energy Corp. (NYSE:DVN) has recorded the largest single upstream impairment charge in its income statement at US$4.9 billion.

Source: Evaluate Energy (https://www.evaluateenergy.com/) (see note 1)
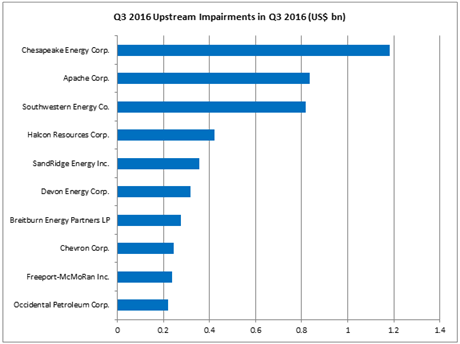
As for the three month Q3 period alone, the largest upstream impairment was Chesapeake Energy Corp.’s (NYSE:CKE) $1.2 billion charge on oil and gas properties and other fixed assets, which represented around 38% of its total 2016 impairment charges of $3.1 billion.

Source: Evaluate Energy (https://www.evaluateenergy.com/)
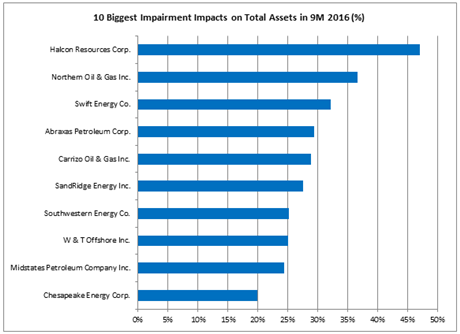
While it did not have the largest actual figure relating to impairments, the largest impact of 9M 2016 impairments was felt by Halcon Resources Corp. (NYSE:HK). The company’s $1.2 billion impairment charge over the 9 month period – either side of bankruptcy proceedings – made up the biggest proportion (47%) of pre-impairment total assets at period end across the entire U.S. E&P space.

Source: Evaluate Energy (https://www.evaluateenergy.com/) (see note 2)
Evaluate Energy (https://www.evaluateenergy.com/) covers the entire U.S. oil and gas space, with historical financial and operating performance coverage for every single U.S. listed oil and gas company with E&P or refinery interests. To find out more, please download our brochure (https://info.evaluateenergy.com/evaluate-energy-find-out-more) .
Notes:
1) Chevron’s impairment figure may include costs related to tax adjustments & environmental remediation provisions and severance accruals, as no breakdown of “Impairments and other charges – E&P” is reported.
2) The percentage fall in total assets for 9M 2016 is calculated by comparing 9M 2016 impairments with the total assets figure for 9M 2016 (pre-impairment charge). This gives an estimate of how big an impact the 9M 2016 impairments had on a company’s total assets at the end of the period, i.e. if it wasn’t for the impairments, Halcon’s total assets figure would have been around 47% higher.