The US stock market opened today with mixed opening prices. The crash of the Ethiopian Boeing passenger jet prompted selling in the Blue Chips, particularly in Boeing (BA). As of right now, the US stock markets have recovered quite well and have pushed higher by mid-day.
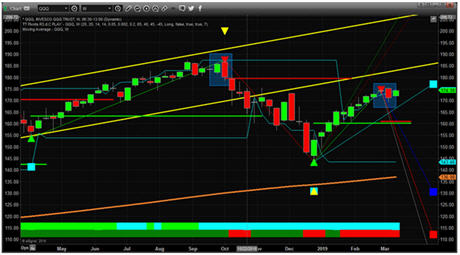
We believe this upward rotation may be short-lived and want to highlight the two Engulfing Bearish candlestick patterns that have formed recently. The first, near the October 2018 highs, prompted a very deep price correction that ended on December 24, 2018. The more recent, completed just on March 8, 2019, is setting up resistance just above recent highs ($175.95) and is still a very valid sell signal for the QQQ. Unless the price is able to breach the $175.95 level over the next few weeks, this Engulfing Bearish candlestick pattern is technically the key pattern driving future expectations for the price.
Our February 17
th research, “Get Ready For A Breakout Pattern Setup”:
https://www.thetechnicaltraders.com/get-ready-for-the-breakout-pattern-setup-part-ii/, highlighted our expectations that the US Stock market would set up a larger Pennant formation with downward rotation near current levels. This setup has, historically, been prominent in the markets and has setup larger upside breakout moves in the past. We still believe this pattern is setting up and that downside price MUST take place before any new upside momentum breakout can begin to unfold.

Our belief is that today's upside price move will falter throughout this week and prices will continue to decrease as the price trend continues. The two Engulfing Bearish patterns are very strong indicators of potential downside price trends forming. Again, unless the $175.95 level is breached, we strongly believe the downside price trend will continue. Plan and prepare for a deeper price rotation before any upside momentum breakout pattern unfolds.
If you like our research and our level of insight into the markets, then take a minute to visit
www.TheTechnicalTraders.com to learn how we help our clients find and execute for success. We've been calling these market moves almost perfectly over the past 18+ months. Learn how our research team can help you stay ahead of these swings in price and find new opportunities for skilled traders. Take a minute to see how we can help you find and execute better trades by visiting
www.TheTechnicalTraders.com today.
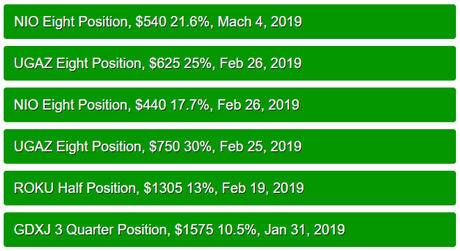
RECENT CLOSED TRADES

Chris Vermeulen
Technical Traders Ltd.