Bitcoin had a great start into 2020. Peaking out after a strong rally at US$10,500, the king of crypto has been under pressure due to the healthy need for a pullback. However, thanks to corona this healthy pullback will likely extended into a more severe correction towards with prices below US$8,000. In fact, the potential reverse head and shoulder pattern points to a low at around US$7,200 to US$7,800 in the next few months. This might deliver the last real contrarian opportunity to buy Bitcoin with a reasonable risk/reward before the crypto currency is expected to resume its bull market. Bitcoin – Seeing The Opportunity In Challenging Times!
Review
Since December 18th, Bitcoin as well as numerous altcoins have seen a massive recovery rally. Bitcoin moved to a high at US$10,500 in just eight weeks (+62%). Altcoins such as Ethereum (+ 146%), DASH (+ 275%), EOS (+ 154%), Bincance Coin (+ 125%), ZCoin (+ 250%) and BAT (+ 120%) literally exploded from their December lows.
Since about two weeks, the crypto sector has started a normal and healthy pullback. With the black swan “Coronavirus” and the resulting liquidity crunch in all financial markets, however, this pullback has expanded significantly in recent days. Bitcoin so far has dropped back to US$8,450 (down -19.4% from the January highs). This return is still in the frame. In the current panic environment, however, the risk of a much deeper pullback has increased quite a lot. However, with an increase of 19.45% since the beginning of the year, Bitcoin continues to outshine all other financial investments!
Technical Analysis For Bitcoin
Depending on how you connect the series of lower highs over the past two years, bitcoin failed at or just slightly below that downtrend line on February 12th and 13th with price around US$10,500. As the long-term uptrend is pushing upwards from below at the same time, Bitcoin will run into the ascent of a giant triangle in the first half of 2020. A breakout is likely to trigger a significant price movement. If Bitcoin can therefore break through the downtrend line in summer, a rapid rally towards the next resistance zone around US$13,500 to US$14,000 should follow. The all-time high at around US$20,000 is already waiting above this zone!
Potential low between US$7,200 and US$7,800
Looking ahead for the next few weeks, the pullback has triggered a sell signal for the stochastic oscillator, meaning prices will likely move lower in the next few weeks. In addition to the uptrend line (currently around US$7,800), possible price targets include the 61.8% retracement of the previous wave up at US$7,231 and the US$8,200 to US$7,700 support zone in general. A narrower definition would give us a potential low between US$7,200 and US$7,800.
Altogether, the weekly chart has turned bearish. A deep pullback below US$7,800 would result in another wonderful buying opportunity for contrarians. This could actually be the last good buying opportunity before Bitcoin takes off to new heights. With a bullish breakout from the triangle to the upside a new bull market could finally begin in early summer.
A reverse head and shoulder formation appears to have been developing on the daily chart since last autumn. The neckline ranges between US$10,350 and US$10,500. The target price for the right shoulder is around $ 7,200 to US$7,400. Upon completion, this formation has the potential to catapult Bitcoin prices towards US$16,500 to US$17,000.
In the short term, however, the daily chart is oversold, therefore sharp recoveries are possible at any time. In addition, prices are currently hovering around the 200-day moving average (US$8,749), which is also of some importance in the highly volatile Bitcoin trading. Falling short of this moving average could mislead emotional driven market participants to throw their bitcoins onto the market just a few months before the next big up wave might start …
In the conclusion, the daily chart is bearish, but clearly oversold in the short term. A sharp bounce is now possible at any time but will likely not be sustainable in the current panic environment shaped by the Corona Virus. Below US$8,000, and especially below US$7,800, you should definitely use any beaten down bitcoin pricing this spring to buy with both hands.
Commitments of Traders Report For Bitcoin Futures
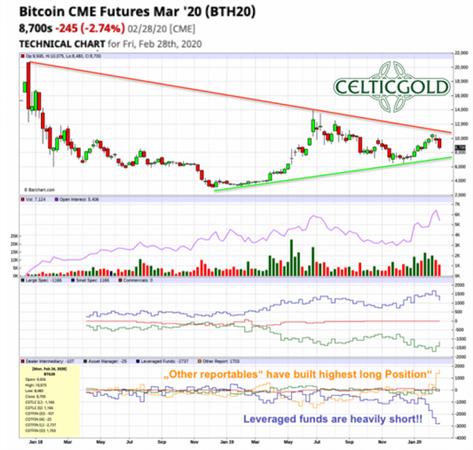
Bitcoin CME Future CoT-report, Source: Barchart
Although Bitcoin Futures have only been trading since December 17th, 2017, the CoT report (Commitment of Trades), which is published every Friday evening, offers an interesting overview of the positions and is definitely a helpful tool to analyze the Bitcoin market. Not that the bitcoin future with the symbol XBT is trading at the CBOE while the symbol BTC refers to to the CME.
Generally, Futures are highly regulated, yet leveraged or marginally financed financial products that are traded on margin. With only a relatively small collateral significantly larger volumes can be moved. The CME future trades 5 bitcoins per contract, i.e. at a price of US$10,000 per bitcoin, a bitcoin future costs US$50,000. To trade the Bitcoin March Future, you currently need a deposited margin of US$14,355. That gives you a leverage of at least 3.5. In a highly volatile asset-class such as Bitcoin, the daily fluctuations in a Bitcoin future position can easily make up 10-30%.
In the so-called commitment of trades reports (CoT report), the focus of our analysis is usually on extreme constellations and the positioning of the “professional money”. These professionals (also called commercials) have so far hardly been active in the Bitcoin Futures market, since there are not yet many investment products that need to be hedged via future contracts.
In the past two years however, the subgroup of the so-called “Other Reportables” has emerged with a very successful contrarian approach. The group “Other Reportables” is not listed individually in the normal CoT report and represents all reportable traders who cannot be assigned to one of the three groups of producers, swap dealers or money managers.
The “Other Reportables” are heavily long
With a total of 1,703 long contracts these “Other Reportables” have accumulated the highest long position of all time in the past few weeks. Considering this group’s excellent track record, this is a promising starting point for significantly higher prices in the next three to ten months. On the other hand, the leveraged funds sold 2,737 futures contracts short. These Bitcoins were sold short on paper, as this group does not even own bitcoin, but only trades on paper. In view of the upcoming bitcoin halving and the resulting shrinking supply, one wonders how they can take on such a risk.
Overall, our analysis of the current CoT report delivers a surprisingly bullish signal. The successful group of “other reportables” has been expanding its long exposure for a few weeks now, while the leveraged speculators are massively short. In our eyes, an ideal set up for another spectacular rally in Bitcoin! However, it must be said that the CoT report does not necessarily prove to be a good timing tool. Extreme conditions can sometimes last for months or even a year.
Sentiment Bitcoin – Seeing The Opportunity In Challenging Times
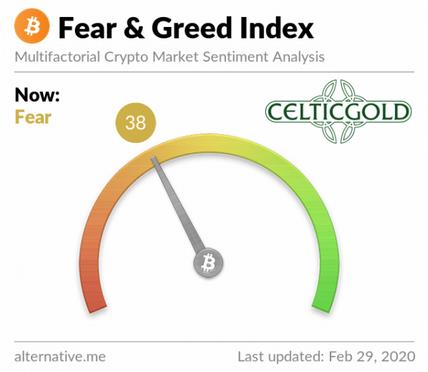
In mid-December, after an almost six-month correction in the sector, sentiment fell to an extreme low. Both, Sentimentrader’s Bitcoin Optix as well as the much more extensive “Fear & Greed Index” provided contrarian buy signals at that time.
Six weeks later at the end of January, however, a somewhat overly optimistic mood was observed. Therefore, the pullback over the last three weeks was only logical. Currently, the sentiment barometer is moving towards pessimism and fear once again.
Despite the first signs of panic during last week, the Fear & Greed Index has not yet provided a contrarian buy signal. To do this, the barometer would have to fall below at least 20, ideally below 15. If Bitcoin continues to correct down to around and below US$8,000, sentiment should flash a contrarian opportunity once again.
Seasonality Bitcoin – Seeing The Opportunity In Challenging Times
Based on the evaluation of the last nine years, Bitcoin has developed a fairly clear seasonal pattern which certainly is a useful tool for general timing. Considering the statistical data, the crypto sector should currently be at the beginning of an uptrend, which typically can last into the summer. It is quite possible, however, that the Corona Virus will stretch this pattern a bit this year and that the next multi-months up wave will start later in spring this year.
In any case, the seasonal component is increasingly favorable from the end of February and supports rising Bitcoin prices into the summer.
Bitcoin Against Gold
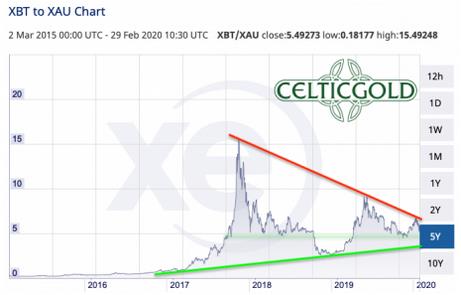
Bitcoin/Gold-Ratio. Source: XE
Bitcoin currently costs 5.49 ounces of gold. In other words, you have to pay 0.181 Bitcoin for an ounce of gold! Bitcoin has appreciated a lot against gold since the beginning of this year. In the bigger picture, the bitcoin/gold-ratio continues to run into a huge triangle. The direction towards which this huge triangle will be resolved cannot yet be reliably predicted. However, the likelihood that it will break to the upside has certainly increased thanks to the recent test of the upper edge in January! The most important thing is that you are aware of this constellation. That is because as soon as this triangle is dissolved, one of the two asset classes should dramatically outperform the other.
Generally, one should be invested in both asset classes. The recommended allocation in precious metals (primarily physical) should be at least 10% and a maximum of 25% of one’s total assets. In cryptos and especially in Bitcoin investors should hold at least 1% and a maximum of 5%. If you are very familiar with crypto currencies and Bitcoin, you can individually allocate higher percentages in Bitcoin. For the normal investor, who of course is invested mainly in equities and real estate, holding 5% in the highly speculative and highly volatile Bitcoin is already quite a lot!
Conclusion And Recommendation:
The Corona Virus caused a “black swan event” for all financial markets and led to massive selloffs in all asset classes during the past trading week. In blind panic, investors basically sold pretty much everything. Bitcoin also came under severe pressure right at the start of the last week. It lost nearly US$1,000 over the course of this historic week. In the current panic, nobody needs Bitcoin. All that matters in the short term is cash.
But if you think through the possible consequences of the Corona Virus crisis, the worst-case scenario is that central banks and governments will sooner or later initiate massive liquidity injections into the broken system. In connection with disrupted logistic chains and grocery hoarding, goods and food may become scarce, while the money supply increases dramatically. As a result, prices are likely to shoot through the roof. The consequences of the long-term expansion of the money supply will become apparent at the supermarket checkout in no time. Then the hour of scarce and safe havens has come. Bitcoin is one of them – and probably the rarest in the digital 21st century.
Deflation first
Technically, Bitcoin still has a few difficult weeks ahead. The potential head and shoulder formation points to a low in the range of US$7,200 to US$7,800. This could provide the last really good risk/reward to get positioned in the long term. If you are a contrarian and patient investors you should focus on Bitcoin – Seeing The Opportunity In Challenging Times.
Analysis sponsored and initially published by www.celticgold.eu.
If you like to get regular updates on our gold model, precious metals and cryptocurrencies you can subscribe to our free newsletter.