Dollars in thousands except per share amounts. Certain items in the prior period financial statements have been reclassified to conform with the March 31, 2023 presentation
FENTON, Mich., April 28, 2023 (GLOBE NEWSWIRE) -- Fentura Financial, Inc. (OTCQX: FETM) announces quarterly net income results of $3,844 for the three months ended March 31, 2023.
Ronald L. Justice, President and CEO, stated, “Our first quarter performance reflects the success of our strategic growth plan, the hard work of our associates, and the value we provide our communities. We continue to focus on navigating a complex operating environment associated with recent bank failures, higher interest rates and increased economic uncertainty. During the quarter, earnings increased 26.1% to $0.87 per share, benefiting from recent asset growth, a stable net interest margin, and robust asset quality. In addition, record loans, assets, and deposits at March 31, 2023, demonstrates that our model is adaptable, resilient, and positioned to deliver solid financial results in the future.”
Mr. Justice continued, “As we celebrate our 125th anniversary later this year, we are focused on continuing our legacy that was built on serving our local communities and providing leading financial resources to our business and retail customers. The Bank’s success over the past 125 years is a testament to our conservative operating philosophy, robust balance sheet, excellent asset quality, and stable liquidity position. Our commitment to follow these operating values will continue to be the foundation of our success in 2023 and beyond.”
Following is a discussion of our financial performance as of, and for the three months ended March 31, 2023. At the end of this document is a list of abbreviations and acronyms.
Results of Operations (unaudited)
The following table outlines our QTD results of operations and provides certain performance measures as of, and for the three months ended:
|
|
3/31/2023 |
|
12/31/2022 |
|
9/30/2022 |
|
6/30/2022 |
|
3/31/2022 |
| INCOME STATEMENT DATA |
|
|
|
|
|
|
|
|
|
|
| Interest income |
|
$ |
18,679 |
|
|
$ |
17,782 |
|
|
$ |
15,726 |
|
|
$ |
13,411 |
|
|
$ |
12,301 |
|
| Interest expense |
|
|
5,335 |
|
|
|
3,645 |
|
|
|
1,738 |
|
|
|
785 |
|
|
|
599 |
|
| Net interest income |
|
|
13,344 |
|
|
|
14,137 |
|
|
|
13,988 |
|
|
|
12,626 |
|
|
|
11,702 |
|
| Provision for loan losses |
|
|
236 |
|
|
|
847 |
|
|
|
1,231 |
|
|
|
525 |
|
|
|
502 |
|
| Noninterest income |
|
|
2,328 |
|
|
|
1,949 |
|
|
|
2,395 |
|
|
|
2,794 |
|
|
|
2,808 |
|
| Noninterest expenses |
|
|
10,633 |
|
|
|
9,781 |
|
|
|
10,143 |
|
|
|
10,560 |
|
|
|
10,167 |
|
| Federal income tax expense |
|
|
959 |
|
|
|
1,094 |
|
|
|
1,000 |
|
|
|
859 |
|
|
|
757 |
|
| Net income |
|
$ |
3,844 |
|
|
$ |
4,364 |
|
|
$ |
4,009 |
|
|
$ |
3,476 |
|
|
$ |
3,084 |
|
| PER SHARE |
|
|
|
|
|
|
|
|
|
|
| Earnings |
|
$ |
0.87 |
|
|
$ |
0.99 |
|
|
$ |
0.91 |
|
|
$ |
0.79 |
|
|
$ |
0.69 |
|
| Dividends |
|
$ |
0.10 |
|
|
$ |
0.09 |
|
|
$ |
0.09 |
|
|
$ |
0.09 |
|
|
$ |
0.09 |
|
| Tangible book value(1) |
|
$ |
26.64 |
|
|
$ |
26.22 |
|
|
$ |
25.22 |
|
|
$ |
24.53 |
|
|
$ |
24.97 |
|
| Quoted market value |
|
|
|
|
|
|
|
|
|
|
| High |
|
$ |
24.10 |
|
|
$ |
23.40 |
|
|
$ |
25.20 |
|
|
$ |
27.85 |
|
|
$ |
29.25 |
|
| Low |
|
$ |
21.10 |
|
|
$ |
21.60 |
|
|
$ |
23.00 |
|
|
$ |
24.40 |
|
|
$ |
27.10 |
|
| Close(1) |
|
$ |
21.31 |
|
|
$ |
22.20 |
|
|
$ |
23.00 |
|
|
$ |
25.00 |
|
|
$ |
27.90 |
|
| PERFORMANCE RATIOS |
|
|
|
|
|
|
|
|
|
|
| Return on average assets |
|
|
0.92 |
% |
|
|
1.06 |
% |
|
|
1.02 |
% |
|
|
0.96 |
% |
|
|
0.86 |
% |
| Return on average shareholders’ equity |
|
|
12.32 |
% |
|
|
14.01 |
% |
|
|
12.96 |
% |
|
|
11.55 |
% |
|
|
10.53 |
% |
| Return on average tangible shareholders’ equity |
|
|
13.34 |
% |
|
|
15.21 |
% |
|
|
14.10 |
% |
|
|
12.60 |
% |
|
|
11.49 |
% |
| Efficiency ratio |
|
|
67.85 |
% |
|
|
60.80 |
% |
|
|
61.91 |
% |
|
|
68.48 |
% |
|
|
70.07 |
% |
| Yield on earning assets (FTE) |
|
|
4.75 |
% |
|
|
4.57 |
% |
|
|
4.27 |
% |
|
|
3.96 |
% |
|
|
3.70 |
% |
| Rate on interest bearing liabilities |
|
|
2.02 |
% |
|
|
1.42 |
% |
|
|
0.75 |
% |
|
|
0.38 |
% |
|
|
0.29 |
% |
| Net interest margin to earning assets (FTE) |
|
|
3.40 |
% |
|
|
3.63 |
% |
|
|
3.79 |
% |
|
|
3.73 |
% |
|
|
3.52 |
% |
| BALANCE SHEET DATA(1) |
|
|
|
|
|
|
|
|
|
|
| Total investment securities |
|
$ |
122,995 |
|
|
$ |
125,049 |
|
|
$ |
129,886 |
|
|
$ |
136,725 |
|
|
$ |
151,579 |
|
| Gross loans |
|
$ |
1,457,173 |
|
|
$ |
1,436,166 |
|
|
$ |
1,350,851 |
|
|
$ |
1,232,892 |
|
|
$ |
1,139,351 |
|
| Allowance for credit losses |
|
$ |
15,220 |
|
|
$ |
13,000 |
|
|
$ |
12,200 |
|
|
$ |
11,000 |
|
|
$ |
11,000 |
|
| Total assets |
|
$ |
1,749,073 |
|
|
$ |
1,688,863 |
|
|
$ |
1,588,592 |
|
|
$ |
1,471,454 |
|
|
$ |
1,435,485 |
|
| Total deposits |
|
$ |
1,353,918 |
|
|
$ |
1,332,883 |
|
|
$ |
1,345,209 |
|
|
$ |
1,231,543 |
|
|
$ |
1,252,892 |
|
| Borrowed funds |
|
$ |
259,050 |
|
|
$ |
222,350 |
|
|
$ |
116,600 |
|
|
$ |
111,000 |
|
|
$ |
52,000 |
|
| Total shareholders’ equity |
|
$ |
128,247 |
|
|
$ |
126,087 |
|
|
$ |
121,630 |
|
|
$ |
118,566 |
|
|
$ |
121,346 |
|
| Net loans to total deposits |
|
|
106.50 |
% |
|
|
106.77 |
% |
|
|
99.51 |
% |
|
|
99.22 |
% |
|
|
90.06 |
% |
| Common shares outstanding |
|
|
4,453,951 |
|
|
|
4,439,725 |
|
|
|
4,434,937 |
|
|
|
4,429,357 |
|
|
|
4,459,544 |
|
| QTD BALANCE SHEET AVERAGES |
|
|
|
|
|
|
|
|
|
|
| Total assets |
|
$ |
1,687,175 |
|
|
$ |
1,637,191 |
|
|
$ |
1,558,040 |
|
|
$ |
1,449,874 |
|
|
$ |
1,448,545 |
|
| Earning assets |
|
$ |
1,595,605 |
|
|
$ |
1,544,880 |
|
|
$ |
1,464,233 |
|
|
$ |
1,360,658 |
|
|
$ |
1,348,647 |
|
| Interest bearing liabilities |
|
$ |
1,072,417 |
|
|
$ |
1,016,876 |
|
|
$ |
917,888 |
|
|
$ |
826,708 |
|
|
$ |
831,200 |
|
| Total shareholders’ equity |
|
$ |
126,495 |
|
|
$ |
123,567 |
|
|
$ |
122,695 |
|
|
$ |
120,659 |
|
|
$ |
118,759 |
|
| Total tangible shareholders’ equity |
|
$ |
116,834 |
|
|
$ |
113,810 |
|
|
$ |
112,829 |
|
|
$ |
110,686 |
|
|
$ |
108,862 |
|
| Earned common shares outstanding |
|
|
4,421,584 |
|
|
|
4,413,710 |
|
|
|
4,408,399 |
|
|
|
4,417,447 |
|
|
|
4,451,607 |
|
| Unvested stock grants |
|
|
29,007 |
|
|
|
24,460 |
|
|
|
24,460 |
|
|
|
24,460 |
|
|
|
27,466 |
|
| Total common shares outstanding |
|
|
4,450,591 |
|
|
|
4,438,170 |
|
|
|
4,432,859 |
|
|
|
4,441,907 |
|
|
|
4,479,073 |
|
| ASSET QUALITY |
|
|
|
|
|
|
|
|
|
|
| Nonperforming loans to gross loans (1) |
|
|
0.19 |
% |
|
|
0.16 |
% |
|
|
0.12 |
% |
|
|
0.16 |
% |
|
|
0.20 |
% |
| Nonperforming assets to total assets (1) |
|
|
0.17 |
% |
|
|
0.15 |
% |
|
|
0.12 |
% |
|
|
0.16 |
% |
|
|
0.19 |
% |
| Allowance for credit losses to gross loans (1) |
|
|
1.04 |
% |
|
|
0.91 |
% |
|
|
0.90 |
% |
|
|
0.89 |
% |
|
|
0.97 |
% |
| Allowance for credit losses to gross loans, net of PPP loans (1) |
|
|
1.04 |
% |
|
|
0.91 |
% |
|
|
0.90 |
% |
|
|
0.89 |
% |
|
|
0.97 |
% |
| Net charge-offs (recoveries) to QTD average gross loans |
|
|
— |
% |
|
|
— |
% |
|
|
— |
% |
|
|
0.04 |
% |
|
|
— |
% |
| Provision for loan losses to QTD average gross loans |
|
|
0.02 |
% |
|
|
0.06 |
% |
|
|
0.10 |
% |
|
|
0.04 |
% |
|
|
0.05 |
% |
| CAPITAL RATIOS(1) |
|
|
|
|
|
|
|
|
|
|
| Total capital to risk weighted assets |
|
|
11.08 |
% |
|
|
10.87 |
% |
|
|
10.96 |
% |
|
|
11.36 |
% |
|
|
12.07 |
% |
| Tier 1 capital to risk weighted assets |
|
|
10.02 |
% |
|
|
9.95 |
% |
|
|
10.07 |
% |
|
|
10.50 |
% |
|
|
11.13 |
% |
| CET1 capital to risk weighted assets |
|
|
9.04 |
% |
|
|
8.96 |
% |
|
|
9.04 |
% |
|
|
9.39 |
% |
|
|
9.94 |
% |
| Tier 1 leverage ratio |
|
|
8.47 |
% |
|
|
8.58 |
% |
|
|
8.91 |
% |
|
|
9.30 |
% |
|
|
9.07 |
% |
|
|
|
|
|
|
|
|
|
|
|
| (1)At end of period |
|
|
|
|
|
|
|
|
|
|
|
|
|
|
|
|
|
|
|
|
|
The following table outlines our YTD results of operations and provides certain performance measures as of, and for the three months ended (unaudited):
|
|
3/31/2023 |
|
3/31/2022 |
|
3/31/2021 |
|
3/31/2020 |
|
3/31/2019 |
| INCOME STATEMENT DATA |
|
|
|
|
|
|
|
|
|
|
| Interest income |
|
$ |
18,679 |
|
|
$ |
12,301 |
|
|
$ |
11,919 |
|
|
$ |
11,070 |
|
|
$ |
10,437 |
|
| Interest expense |
|
|
5,335 |
|
|
|
599 |
|
|
|
676 |
|
|
|
2,145 |
|
|
|
2,090 |
|
| Net interest income |
|
|
13,344 |
|
|
|
11,702 |
|
|
|
11,243 |
|
|
|
8,925 |
|
|
|
8,347 |
|
| Provision for loan losses |
|
|
236 |
|
|
|
502 |
|
|
|
212 |
|
|
|
1,542 |
|
|
|
213 |
|
| Noninterest income |
|
|
2,328 |
|
|
|
2,808 |
|
|
|
3,906 |
|
|
|
4,575 |
|
|
|
1,522 |
|
| Noninterest expenses |
|
|
10,633 |
|
|
|
10,167 |
|
|
|
9,083 |
|
|
|
7,748 |
|
|
|
6,509 |
|
| Federal income tax expense |
|
|
959 |
|
|
|
757 |
|
|
|
1,198 |
|
|
|
858 |
|
|
|
633 |
|
| Net income |
|
$ |
3,844 |
|
|
$ |
3,084 |
|
|
$ |
4,656 |
|
|
$ |
3,352 |
|
|
$ |
2,514 |
|
| PER SHARE |
|
|
|
|
|
|
|
|
|
|
| Earnings |
|
$ |
0.87 |
|
|
$ |
0.69 |
|
|
$ |
1.00 |
|
|
$ |
0.72 |
|
|
$ |
0.54 |
|
| Dividends |
|
$ |
0.10 |
|
|
$ |
0.09 |
|
|
$ |
0.08 |
|
|
$ |
0.08 |
|
|
$ |
0.07 |
|
| Tangible book value(1) |
|
$ |
26.64 |
|
|
$ |
24.97 |
|
|
$ |
24.75 |
|
|
$ |
21.56 |
|
|
$ |
18.88 |
|
| Quoted market value |
|
|
|
|
|
|
|
|
|
|
| High |
|
$ |
24.10 |
|
|
$ |
29.25 |
|
|
$ |
24.75 |
|
|
$ |
26.00 |
|
|
$ |
21.00 |
|
| Low |
|
$ |
21.10 |
|
|
$ |
27.10 |
|
|
$ |
21.90 |
|
|
$ |
12.55 |
|
|
$ |
20.05 |
|
| Close(1) |
|
$ |
21.31 |
|
|
$ |
27.90 |
|
|
$ |
23.30 |
|
|
$ |
15.50 |
|
|
$ |
20.89 |
|
| PERFORMANCE RATIOS |
|
|
|
|
|
|
|
|
|
|
| Return on average assets |
|
|
0.92 |
% |
|
|
0.86 |
% |
|
|
1.50 |
% |
|
|
1.28 |
% |
|
|
1.09 |
% |
| Return on average shareholders’ equity |
|
|
12.32 |
% |
|
|
10.53 |
% |
|
|
15.86 |
% |
|
|
13.01 |
% |
|
|
11.09 |
% |
| Return on average tangible shareholders’ equity |
|
|
13.34 |
% |
|
|
11.49 |
% |
|
|
16.38 |
% |
|
|
13.54 |
% |
|
|
11.66 |
% |
| Efficiency ratio |
|
|
67.85 |
% |
|
|
70.07 |
% |
|
|
59.96 |
% |
|
|
57.39 |
% |
|
|
65.95 |
% |
| Yield on earning assets (FTE) |
|
|
4.75 |
% |
|
|
3.70 |
% |
|
|
4.01 |
% |
|
|
4.47 |
% |
|
|
4.77 |
% |
| Rate on interest bearing liabilities |
|
|
2.02 |
% |
|
|
0.29 |
% |
|
|
0.37 |
% |
|
|
1.28 |
% |
|
|
1.40 |
% |
| Net interest margin to earning assets (FTE) |
|
|
3.40 |
% |
|
|
3.52 |
% |
|
|
3.79 |
% |
|
|
3.61 |
% |
|
|
3.81 |
% |
| BALANCE SHEET DATA(1) |
|
|
|
|
|
|
|
|
|
|
| Total investment securities |
|
$ |
122,995 |
|
|
$ |
151,579 |
|
|
$ |
89,772 |
|
|
$ |
76,312 |
|
|
$ |
82,222 |
|
| Gross loans |
|
$ |
1,457,173 |
|
|
$ |
1,139,351 |
|
|
$ |
1,028,117 |
|
|
$ |
865,577 |
|
|
$ |
809,863 |
|
| Allowance for credit losses |
|
$ |
15,220 |
|
|
$ |
11,000 |
|
|
$ |
11,100 |
|
|
$ |
7,250 |
|
|
$ |
4,745 |
|
| Total assets |
|
$ |
1,749,073 |
|
|
$ |
1,435,485 |
|
|
$ |
1,303,175 |
|
|
$ |
1,071,181 |
|
|
$ |
946,172 |
|
| Total deposits |
|
$ |
1,353,918 |
|
|
$ |
1,252,892 |
|
|
$ |
1,122,508 |
|
|
$ |
883,837 |
|
|
$ |
789,533 |
|
| Borrowed funds |
|
$ |
259,050 |
|
|
$ |
52,000 |
|
|
$ |
49,000 |
|
|
$ |
71,500 |
|
|
$ |
59,000 |
|
| Total shareholders’ equity |
|
$ |
128,247 |
|
|
$ |
121,346 |
|
|
$ |
119,360 |
|
|
$ |
104,829 |
|
|
$ |
92,236 |
|
| Net loans to total deposits |
|
|
106.50 |
% |
|
|
90.06 |
% |
|
|
90.60 |
% |
|
|
97.11 |
% |
|
|
101.97 |
% |
| Common shares outstanding |
|
|
4,453,951 |
|
|
|
4,459,544 |
|
|
|
4,673,932 |
|
|
|
4,675,499 |
|
|
|
4,647,978 |
|
| YTD BALANCE SHEET AVERAGES |
|
|
|
|
|
|
|
|
|
|
| Total assets |
|
$ |
1,687,175 |
|
|
$ |
1,448,545 |
|
|
$ |
1,259,119 |
|
|
$ |
1,049,245 |
|
|
$ |
934,078 |
|
| Earning assets |
|
$ |
1,595,605 |
|
|
$ |
1,348,647 |
|
|
$ |
1,206,411 |
|
|
$ |
997,089 |
|
|
$ |
887,974 |
|
| Interest bearing liabilities |
|
$ |
1,072,417 |
|
|
$ |
831,200 |
|
|
$ |
735,159 |
|
|
$ |
672,564 |
|
|
$ |
604,973 |
|
| Total shareholders’ equity |
|
$ |
126,495 |
|
|
$ |
118,759 |
|
|
$ |
119,034 |
|
|
$ |
103,646 |
|
|
$ |
91,964 |
|
| Total tangible shareholders’ equity |
|
$ |
116,834 |
|
|
$ |
108,862 |
|
|
$ |
115,298 |
|
|
$ |
99,558 |
|
|
$ |
87,430 |
|
| Earned common shares outstanding |
|
|
4,421,584 |
|
|
|
4,451,607 |
|
|
|
4,664,893 |
|
|
|
4,659,279 |
|
|
|
4,635,255 |
|
| Unvested stock grants |
|
|
29,007 |
|
|
|
27,466 |
|
|
|
21,922 |
|
|
|
13,481 |
|
|
|
9,788 |
|
| Total common shares outstanding |
|
|
4,450,591 |
|
|
|
4,479,073 |
|
|
|
4,686,815 |
|
|
|
4,672,760 |
|
|
|
4,645,043 |
|
| ASSET QUALITY |
|
|
|
|
|
|
|
|
|
|
| Nonperforming loans to gross loans (1) |
|
|
0.19 |
% |
|
|
0.20 |
% |
|
|
0.79 |
% |
|
|
0.10 |
% |
|
|
0.11 |
% |
| Nonperforming assets to total assets (1) |
|
|
0.17 |
% |
|
|
0.19 |
% |
|
|
0.62 |
% |
|
|
0.12 |
% |
|
|
0.09 |
% |
| Allowance for credit losses to gross loans (1) |
|
|
1.04 |
% |
|
|
0.97 |
% |
|
|
1.08 |
% |
|
|
0.84 |
% |
|
|
0.59 |
% |
| Allowance for credit losses to gross loans, net of PPP loans (1) |
|
|
1.04 |
% |
|
|
0.97 |
% |
|
|
1.23 |
% |
|
|
0.84 |
% |
|
|
0.59 |
% |
| Net charge-offs (recoveries) to YTD average gross loans |
|
|
— |
% |
|
|
— |
% |
|
|
— |
% |
|
|
0.01 |
% |
|
(0.01) % |
| Provision for loan losses to YTD average gross loans |
|
|
0.02 |
% |
|
|
0.05 |
% |
|
|
0.02 |
% |
|
|
0.18 |
% |
|
|
0.03 |
% |
| CAPITAL RATIOS(1) |
|
|
|
|
|
|
|
|
|
|
| Total capital to risk weighted assets |
|
|
11.08 |
% |
|
|
12.07 |
% |
|
|
15.02 |
% |
|
|
14.44 |
% |
|
|
14.01 |
% |
| Tier 1 capital to risk weighted assets |
|
|
10.02 |
% |
|
|
11.13 |
% |
|
|
13.84 |
% |
|
|
13.58 |
% |
|
|
13.38 |
% |
| CET1 capital to risk weighted assets |
|
|
9.04 |
% |
|
|
9.94 |
% |
|
|
12.34 |
% |
|
|
11.92 |
% |
|
|
11.55 |
% |
| Tier 1 leverage ratio |
|
|
8.47 |
% |
|
|
9.07 |
% |
|
|
10.31 |
% |
|
|
10.97 |
% |
|
|
11.00 |
% |
|
|
|
|
|
|
|
|
|
|
|
| (1)At end of period |
|
|
|
|
|
|
|
|
|
|
|
|
|
|
|
|
|
|
|
|
|
Income Statement Breakdown and Analysis
|
|
Quarter to Date |
|
|
3/31/2023 |
|
12/31/2022 |
|
9/30/2022 |
|
6/30/2022 |
|
3/31/2022 |
| Net income |
|
$ |
3,844 |
|
|
$ |
4,364 |
|
|
$ |
4,009 |
|
|
$ |
3,476 |
|
|
$ |
3,084 |
|
| Acquisition related items (net of tax) |
|
|
|
|
|
|
|
|
|
|
| Accretion on purchased loans |
|
|
— |
|
|
|
(20 |
) |
|
|
(20 |
) |
|
|
(20 |
) |
|
|
(20 |
) |
| Amortization of core deposit intangibles |
|
|
60 |
|
|
|
85 |
|
|
|
85 |
|
|
|
85 |
|
|
|
85 |
|
| Amortization on acquired time deposits |
|
|
— |
|
|
|
(21 |
) |
|
|
(21 |
) |
|
|
(21 |
) |
|
|
(21 |
) |
| Other acquisition related expenses |
|
|
— |
|
|
|
— |
|
|
|
— |
|
|
|
11 |
|
|
|
202 |
|
| Total acquisition related items (net of tax) |
|
|
60 |
|
|
|
44 |
|
|
|
44 |
|
|
|
55 |
|
|
|
246 |
|
| Other nonrecurring items (net of tax) |
|
|
|
|
|
|
|
|
|
|
| Prepayment penalties collected |
|
|
(9 |
) |
|
|
(61 |
) |
|
|
(119 |
) |
|
|
(48 |
) |
|
|
(162 |
) |
| Total other nonrecurring items (net of tax) |
|
|
(9 |
) |
|
|
(61 |
) |
|
|
(119 |
) |
|
|
(48 |
) |
|
|
(162 |
) |
| Adjusted net income from operations |
|
$ |
3,895 |
|
|
$ |
4,347 |
|
|
$ |
3,934 |
|
|
$ |
3,483 |
|
|
$ |
3,168 |
|
|
|
|
|
|
|
|
|
|
|
|
| Net interest income |
|
$ |
13,344 |
|
|
$ |
14,137 |
|
|
$ |
13,988 |
|
|
$ |
12,626 |
|
|
$ |
11,702 |
|
| Accretion on purchased loans |
|
|
— |
|
|
|
(25 |
) |
|
|
(25 |
) |
|
|
(26 |
) |
|
|
(25 |
) |
| Prepayment penalties collected |
|
|
(12 |
) |
|
|
(77 |
) |
|
|
(150 |
) |
|
|
(61 |
) |
|
|
(205 |
) |
| Amortization on acquired time deposits |
|
|
— |
|
|
|
(27 |
) |
|
|
(27 |
) |
|
|
(26 |
) |
|
|
(27 |
) |
| Adjusted net interest income |
|
$ |
13,332 |
|
|
$ |
14,008 |
|
|
$ |
13,786 |
|
|
$ |
12,513 |
|
|
$ |
11,445 |
|
|
|
|
|
|
|
|
|
|
|
|
| PERFORMANCE RATIOS |
|
|
|
|
|
|
|
|
|
|
| Based on adjusted net income from operations |
|
|
|
|
|
|
|
|
|
|
| Earnings per share |
|
$ |
0.88 |
|
|
$ |
0.98 |
|
|
$ |
0.89 |
|
|
$ |
0.79 |
|
|
$ |
0.71 |
|
| Return on average assets |
|
|
0.94 |
% |
|
|
1.05 |
% |
|
|
1.00 |
% |
|
|
0.96 |
% |
|
|
0.89 |
% |
| Return on average shareholders’ equity |
|
|
12.49 |
% |
|
|
13.96 |
% |
|
|
12.72 |
% |
|
|
11.58 |
% |
|
|
10.82 |
% |
| Return on average tangible shareholders’ equity |
|
|
13.52 |
% |
|
|
15.15 |
% |
|
|
13.83 |
% |
|
|
12.62 |
% |
|
|
11.80 |
% |
| Efficiency ratio |
|
|
67.41 |
% |
|
|
60.62 |
% |
|
|
62.02 |
% |
|
|
68.19 |
% |
|
|
68.78 |
% |
|
|
|
|
|
|
|
|
|
|
|
| Based on adjusted net interest income |
|
|
|
|
|
|
|
|
|
|
| Yield on earning assets (FTE) |
|
|
4.75 |
% |
|
|
4.54 |
% |
|
|
4.22 |
% |
|
|
3.93 |
% |
|
|
3.63 |
% |
| Rate on interest bearing liabilities |
|
|
2.02 |
% |
|
|
1.41 |
% |
|
|
0.74 |
% |
|
|
0.37 |
% |
|
|
0.28 |
% |
| Net interest margin to earning assets (FTE) |
|
|
3.40 |
% |
|
|
3.60 |
% |
|
|
3.74 |
% |
|
|
3.70 |
% |
|
|
3.44 |
% |
|
|
Year to Date March 31 |
|
Variance |
|
|
2023 |
|
2022 |
|
Amount |
|
% |
| Net income |
|
$ |
3,844 |
|
|
$ |
3,084 |
|
|
$ |
760 |
|
|
24.64 |
% |
| Acquisition related items (net of tax) |
|
|
|
|
|
|
|
|
| Accretion on purchased loans |
|
|
— |
|
|
|
(20 |
) |
|
|
20 |
|
|
(100.00 |
)% |
| Amortization of core deposit intangibles |
|
|
60 |
|
|
|
85 |
|
|
|
(25 |
) |
|
(29.41 |
)% |
| Amortization on acquired time deposits |
|
|
— |
|
|
|
(21 |
) |
|
|
21 |
|
|
(100.00 |
)% |
| Other acquisition related expenses |
|
|
— |
|
|
|
202 |
|
|
|
(202 |
) |
|
(100.00 |
)% |
| Total acquisition related items (net of tax) |
|
|
60 |
|
|
|
246 |
|
|
|
(186 |
) |
|
(75.61 |
)% |
| Other nonrecurring items (net of tax) |
|
|
|
|
|
|
|
|
| Prepayment penalties collected |
|
|
(9 |
) |
|
|
(162 |
) |
|
|
153 |
|
|
(94.44 |
)% |
| Total other nonrecurring items (net of tax) |
|
|
(9 |
) |
|
|
(162 |
) |
|
|
153 |
|
|
(94.44 |
)% |
| Adjusted net income from operations |
|
$ |
3,895 |
|
|
$ |
3,168 |
|
|
$ |
727 |
|
|
22.95 |
% |
|
|
|
|
|
|
|
|
|
| Net interest income |
|
$ |
13,344 |
|
|
$ |
11,702 |
|
|
$ |
1,642 |
|
|
14.03 |
% |
| Accretion on purchased loans |
|
|
— |
|
|
|
(25 |
) |
|
|
25 |
|
|
(100.00 |
)% |
| Prepayment penalties collected |
|
|
(12 |
) |
|
|
(205 |
) |
|
|
193 |
|
|
(94.15 |
)% |
| Amortization on acquired time deposits |
|
|
— |
|
|
|
(27 |
) |
|
|
27 |
|
|
(100.00 |
)% |
| Adjusted net interest income |
|
$ |
13,332 |
|
|
$ |
11,445 |
|
|
$ |
1,887 |
|
|
16.49 |
% |
|
|
|
|
|
|
|
|
|
| PERFORMANCE RATIOS |
|
|
|
|
|
|
|
|
| Based on adjusted net income from operations |
|
|
|
|
|
|
|
|
| Earnings per share |
|
$ |
0.88 |
|
|
$ |
0.71 |
|
|
$ |
0.17 |
|
|
23.94 |
% |
| Return on average assets |
|
|
0.94 |
% |
|
|
0.89 |
% |
|
|
|
0.05 |
% |
| Return on average shareholders’ equity |
|
|
12.49 |
% |
|
|
10.82 |
% |
|
|
|
1.67 |
% |
| Return on average tangible shareholders’ equity |
|
|
13.52 |
% |
|
|
11.80 |
% |
|
|
|
1.72 |
% |
| Efficiency ratio |
|
|
67.41 |
% |
|
|
68.78 |
% |
|
|
|
(1.37 |
)% |
|
|
|
|
|
|
|
|
|
| Based on adjusted net interest income |
|
|
|
|
|
|
|
|
| Yield on earning assets (FTE) |
|
|
4.75 |
% |
|
|
3.63 |
% |
|
|
|
1.12 |
% |
| Rate on interest bearing liabilities |
|
|
2.02 |
% |
|
|
0.28 |
% |
|
|
|
1.74 |
% |
| Net interest margin to earning assets (FTE) |
|
|
3.40 |
% |
|
|
3.44 |
% |
|
|
|
(0.04 |
)% |
|
|
|
|
|
|
|
|
|
Average Balances, Interest Rate, and Net Interest Income
The following tables present the daily average amount outstanding for each major category of interest earning assets, nonearning assets, interest bearing liabilities, and noninterest bearing liabilities. These tables also present an analysis of interest income and interest expense for the periods indicated. All interest income is reported on a FTE basis using a federal income tax rate of 21%. Loans in nonaccrual status, for the purpose of the following computations, are included in the average loan balances.
Net interest income is the amount by which interest income on earning assets exceeds the interest expenses on interest bearing liabilities. Net interest income, which includes loan fees, is influenced by changes in the balance and mix of assets and liabilities and market interest rates. We exert some control over these factors; however, FRB monetary policy and competition have a significant impact. For analytical purposes, net interest income is adjusted to a FTE basis by adding the income tax savings from interest on tax exempt loans, and nontaxable investment securities, thus making period-to-period comparisons more meaningful.
|
|
Three Months Ended |
|
|
March 31, 2023 |
|
December 31, 2022 |
|
March 31, 2022 |
|
|
Average Balance |
|
Tax Equivalent Interest |
|
Average Yield /
Rate |
|
Average Balance |
|
Tax Equivalent Interest |
|
Average Yield /
Rate |
|
Average Balance |
|
Tax Equivalent Interest |
|
Average Yield /
Rate |
| Interest earning assets |
|
|
|
|
|
|
|
|
|
|
|
|
|
|
|
|
|
|
| Total loans |
|
$ |
1,447,375 |
|
|
$ |
17,854 |
|
5.00 |
% |
|
$ |
1,397,113 |
|
|
$ |
17,024 |
|
4.83 |
% |
|
$ |
1,110,755 |
|
|
$ |
11,739 |
|
4.29 |
% |
| Taxable investment securities |
|
|
109,671 |
|
|
|
435 |
|
1.61 |
% |
|
|
112,321 |
|
|
|
443 |
|
1.56 |
% |
|
|
143,945 |
|
|
|
440 |
|
1.24 |
% |
| Nontaxable investment securities |
|
|
14,287 |
|
|
|
81 |
|
2.30 |
% |
|
|
14,326 |
|
|
|
81 |
|
2.24 |
% |
|
|
16,711 |
|
|
|
90 |
|
2.23 |
% |
| Interest earning cash and cash equivalents |
|
|
14,035 |
|
|
|
153 |
|
4.42 |
% |
|
|
12,261 |
|
|
|
116 |
|
3.75 |
% |
|
|
73,669 |
|
|
|
29 |
|
0.16 |
% |
| Federal Home Loan Bank stock |
|
|
10,237 |
|
|
|
173 |
|
6.85 |
% |
|
|
8,859 |
|
|
|
135 |
|
6.05 |
% |
|
|
3,567 |
|
|
|
20 |
|
2.27 |
% |
| Total earning assets |
|
|
1,595,605 |
|
|
|
18,696 |
|
4.75 |
% |
|
|
1,544,880 |
|
|
|
17,799 |
|
4.57 |
% |
|
|
1,348,647 |
|
|
|
12,318 |
|
3.70 |
% |
|
|
|
|
|
|
|
|
|
|
|
|
|
|
|
|
|
|
|
| Nonearning assets |
|
|
|
|
|
|
|
|
|
|
|
|
|
|
|
|
|
|
| Allowance for credit losses |
|
|
(15,145 |
) |
|
|
|
|
|
|
(12,538 |
) |
|
|
|
|
|
|
(10,509 |
) |
|
|
|
|
| Premises and equipment, net |
|
|
15,453 |
|
|
|
|
|
|
|
15,866 |
|
|
|
|
|
|
|
16,941 |
|
|
|
|
|
| Accrued income and other assets |
|
|
91,262 |
|
|
|
|
|
|
|
88,983 |
|
|
|
|
|
|
|
93,466 |
|
|
|
|
|
| Total assets |
|
$ |
1,687,175 |
|
|
|
|
|
|
$ |
1,637,191 |
|
|
|
|
|
|
$ |
1,448,545 |
|
|
|
|
|
|
|
|
|
|
|
|
|
|
|
|
|
|
|
|
|
|
|
|
| Interest bearing liabilities |
|
|
|
|
|
|
|
|
|
|
|
|
|
|
|
|
|
|
| Interest bearing demand deposits |
|
$ |
359,223 |
|
|
$ |
2,078 |
|
2.35 |
% |
|
$ |
320,672 |
|
|
$ |
1,383 |
|
1.71 |
% |
|
$ |
275,856 |
|
|
$ |
137 |
|
0.20 |
% |
| Savings deposits |
|
|
341,154 |
|
|
|
473 |
|
0.56 |
% |
|
|
362,250 |
|
|
|
170 |
|
0.19 |
% |
|
|
364,820 |
|
|
|
120 |
|
0.13 |
% |
| Time deposits |
|
|
166,518 |
|
|
|
1,012 |
|
2.46 |
% |
|
|
133,166 |
|
|
|
523 |
|
1.56 |
% |
|
|
139,463 |
|
|
|
187 |
|
0.54 |
% |
| Borrowed funds |
|
|
205,522 |
|
|
|
1,772 |
|
3.50 |
% |
|
|
200,788 |
|
|
|
1,569 |
|
3.10 |
% |
|
|
51,061 |
|
|
|
155 |
|
1.23 |
% |
| Total interest bearing liabilities |
|
|
1,072,417 |
|
|
|
5,335 |
|
2.02 |
% |
|
|
1,016,876 |
|
|
|
3,645 |
|
1.42 |
% |
|
|
831,200 |
|
|
|
599 |
|
0.29 |
% |
|
|
|
|
|
|
|
|
|
|
|
|
|
|
|
|
|
|
|
| Noninterest bearing liabilities |
|
|
|
|
|
|
|
|
|
|
|
|
|
|
|
|
|
|
| Noninterest bearing deposits |
|
|
474,686 |
|
|
|
|
|
|
|
484,586 |
|
|
|
|
|
|
|
472,595 |
|
|
|
|
|
| Accrued interest and other liabilities |
|
|
13,577 |
|
|
|
|
|
|
|
12,162 |
|
|
|
|
|
|
|
25,991 |
|
|
|
|
|
| Shareholders’ equity |
|
|
126,495 |
|
|
|
|
|
|
|
123,567 |
|
|
|
|
|
|
|
118,759 |
|
|
|
|
|
| Total liabilities and shareholders’ equity |
|
$ |
1,687,175 |
|
|
|
|
|
|
$ |
1,637,191 |
|
|
|
|
|
|
$ |
1,448,545 |
|
|
|
|
|
| Net interest income (FTE) |
|
|
|
$ |
13,361 |
|
|
|
|
|
$ |
14,154 |
|
|
|
|
|
$ |
11,719 |
|
|
| Net interest margin to earning assets (FTE) |
|
|
|
|
|
3.40 |
% |
|
|
|
|
|
3.63 |
% |
|
|
|
|
|
3.52 |
% |
|
|
|
|
|
|
|
|
|
|
|
|
|
|
|
|
|
|
|
Volume and Rate Variance Analysis
The following table sets forth the effect of volume and rate changes on interest income and expense for the periods indicated. For the purpose of this table, changes in interest due to volume and rate were determined as follows:
Volume - change in volume multiplied by the previous period’s rate.
Rate - change in the FTE rate multiplied by the previous period’s volume.
The change in interest due to both volume and rate has been allocated to volume and rate changes in proportion to the relationship of the absolute dollar amounts of the change in each.
|
|
Three Months Ended |
|
Three Months Ended |
|
|
March 31, 2023 |
|
March 31, 2023 |
|
|
Compared To |
|
Compared To |
|
|
December 31, 2022 |
|
March 31, 2022 |
|
|
Increase (Decrease) Due to |
|
Increase (Decrease) Due to |
|
|
Volume |
|
Rate |
|
Net |
|
Volume |
|
Rate |
|
Net |
| Changes in interest income |
|
|
|
|
|
|
|
|
|
|
|
|
| Total loans |
|
$ |
420 |
|
|
$ |
410 |
|
|
$ |
830 |
|
|
$ |
3,955 |
|
|
$ |
2,160 |
|
|
$ |
6,115 |
|
| Taxable investment securities |
|
|
(51 |
) |
|
|
43 |
|
|
|
(8 |
) |
|
|
(475 |
) |
|
|
470 |
|
|
|
(5 |
) |
| Nontaxable investment securities |
|
|
(2 |
) |
|
|
2 |
|
|
|
— |
|
|
|
(27 |
) |
|
|
18 |
|
|
|
(9 |
) |
| Interest earning cash and cash equivalents |
|
|
17 |
|
|
|
20 |
|
|
|
37 |
|
|
|
(181 |
) |
|
|
305 |
|
|
|
124 |
|
| Federal Home Loan Bank stock |
|
|
20 |
|
|
|
18 |
|
|
|
38 |
|
|
|
74 |
|
|
|
79 |
|
|
|
153 |
|
| Total changes in interest income |
|
|
404 |
|
|
|
493 |
|
|
|
897 |
|
|
|
3,346 |
|
|
|
3,032 |
|
|
|
6,378 |
|
|
|
|
|
|
|
|
|
|
|
|
|
|
| Changes in interest expense |
|
|
|
|
|
|
|
|
|
|
|
|
| Interest bearing demand deposits |
|
|
169 |
|
|
|
526 |
|
|
|
695 |
|
|
|
53 |
|
|
|
1,888 |
|
|
|
1,941 |
|
| Savings deposits |
|
|
(69 |
) |
|
|
372 |
|
|
|
303 |
|
|
|
(54 |
) |
|
|
407 |
|
|
|
353 |
|
| Time deposits |
|
|
148 |
|
|
|
341 |
|
|
|
489 |
|
|
|
43 |
|
|
|
782 |
|
|
|
825 |
|
| Borrowed funds |
|
|
31 |
|
|
|
172 |
|
|
|
203 |
|
|
|
1,004 |
|
|
|
613 |
|
|
|
1,617 |
|
| Total changes in interest expense |
|
|
279 |
|
|
|
1,411 |
|
|
|
1,690 |
|
|
|
1,046 |
|
|
|
3,690 |
|
|
|
4,736 |
|
| Net change in net interest income (FTE) |
|
$ |
125 |
|
|
$ |
(918 |
) |
|
$ |
(793 |
) |
|
$ |
2,300 |
|
|
$ |
(658 |
) |
|
$ |
1,642 |
|
|
|
Average Yield/Rate for the Three Months Ended |
|
|
3/31/2023 |
|
12/31/2022 |
|
9/30/2022 |
|
6/30/2022 |
|
3/31/2022 |
| Total earning assets |
|
4.75 |
% |
|
4.57 |
% |
|
4.27 |
% |
|
3.96 |
% |
|
3.70 |
% |
| Total interest bearing liabilities |
|
2.02 |
% |
|
1.42 |
% |
|
0.75 |
% |
|
0.38 |
% |
|
0.29 |
% |
| Net interest margin to earning assets (FTE) |
|
3.40 |
% |
|
3.63 |
% |
|
3.79 |
% |
|
3.73 |
% |
|
3.52 |
% |
|
|
Quarter to Date Net Interest Income (FTE) |
|
|
3/31/2023 |
|
12/31/2022 |
|
9/30/2022 |
|
6/30/2022 |
|
3/31/2022 |
| Interest income |
|
$ |
18,679 |
|
$ |
17,782 |
|
$ |
15,726 |
|
$ |
13,411 |
|
$ |
12,301 |
| FTE adjustment |
|
|
17 |
|
|
17 |
|
|
18 |
|
|
18 |
|
|
17 |
| Total interest income (FTE) |
|
|
18,696 |
|
|
17,799 |
|
|
15,744 |
|
|
13,429 |
|
|
12,318 |
| Total interest expense |
|
|
5,335 |
|
|
3,645 |
|
|
1,738 |
|
|
785 |
|
|
599 |
| Net interest income (FTE) |
|
$ |
13,361 |
|
$ |
14,154 |
|
$ |
14,006 |
|
$ |
12,644 |
|
$ |
11,719 |
|
|
|
|
|
|
|
|
|
|
|
Noninterest Income
|
|
Three Months Ended |
|
|
3/31/2023 |
|
12/31/2022 |
|
9/30/2022 |
|
6/30/2022 |
|
3/31/2022 |
| Service charges and fees |
|
|
|
|
|
|
|
|
|
|
| Trust and investment services |
|
|
549 |
|
|
505 |
|
|
|
546 |
|
|
|
458 |
|
|
|
598 |
|
| ATM and debit card income |
|
|
531 |
|
|
559 |
|
|
|
553 |
|
|
|
577 |
|
|
|
485 |
|
| Service charges on deposit accounts |
|
|
218 |
|
|
245 |
|
|
|
270 |
|
|
|
246 |
|
|
|
241 |
|
| Total |
|
|
1,298 |
|
|
1,309 |
|
|
|
1,369 |
|
|
|
1,281 |
|
|
|
1,324 |
|
| Net gain on sales of loans |
|
|
161 |
|
|
24 |
|
|
|
36 |
|
|
|
182 |
|
|
|
483 |
|
| Changes in the fair value of MSR |
|
|
107 |
|
|
(129 |
) |
|
|
207 |
|
|
|
433 |
|
|
|
319 |
|
| Change in fair value of equity investments |
|
|
14 |
|
|
2 |
|
|
|
(39 |
) |
|
|
(31 |
) |
|
|
(48 |
) |
| Other |
|
|
|
|
|
|
|
|
|
|
| Mortgage servicing fees |
|
|
406 |
|
|
415 |
|
|
|
427 |
|
|
|
435 |
|
|
|
444 |
|
| Change in cash surrender value of corporate owned life insurance |
|
|
173 |
|
|
175 |
|
|
|
172 |
|
|
|
168 |
|
|
|
166 |
|
| Other |
|
|
169 |
|
|
153 |
|
|
|
223 |
|
|
|
326 |
|
|
|
120 |
|
| Total |
|
|
748 |
|
|
743 |
|
|
|
822 |
|
|
|
929 |
|
|
|
730 |
|
| Total noninterest income |
|
$ |
2,328 |
|
$ |
1,949 |
|
|
$ |
2,395 |
|
|
$ |
2,794 |
|
|
$ |
2,808 |
|
|
|
|
|
|
|
|
|
|
|
|
| Memo items: |
|
|
|
|
|
|
|
|
|
|
| Residential mortgage operations |
|
$ |
674 |
|
$ |
310 |
|
|
$ |
670 |
|
|
$ |
1,050 |
|
|
$ |
1,246 |
|
|
|
Three Months Ended March 31 |
|
Variance |
|
|
2023 |
|
|
2022 |
|
|
Amount |
|
% |
| Service charges and fees |
|
|
|
|
|
|
|
|
| Trust and investment services |
|
|
549 |
|
|
598 |
|
|
|
(49 |
) |
|
(8.19 |
)% |
| ATM and debit card income |
|
|
531 |
|
|
485 |
|
|
|
46 |
|
|
9.48 |
% |
| Service charges on deposit accounts |
|
|
218 |
|
|
241 |
|
|
|
(23 |
) |
|
(9.54 |
)% |
| Total |
|
$ |
1,298 |
|
$ |
1,324 |
|
|
|
(26 |
) |
|
(1.96 |
)% |
| Net gain on sales of loans |
|
|
161 |
|
|
483 |
|
|
|
(322 |
) |
|
(66.67 |
)% |
| Changes in the fair value of MSR |
|
|
107 |
|
|
319 |
|
|
|
(212 |
) |
|
(66.46 |
)% |
| Change in fair value of equity investments |
|
|
14 |
|
|
(48 |
) |
|
|
62 |
|
|
(129.17 |
)% |
| Other |
|
|
|
|
|
|
|
|
| Mortgage servicing fees |
|
|
406 |
|
|
444 |
|
|
|
(38 |
) |
|
(8.56 |
)% |
| Change in cash surrender value of corporate owned life insurance |
|
|
173 |
|
|
166 |
|
|
|
7 |
|
|
4.22 |
% |
| Other |
|
|
169 |
|
|
120 |
|
|
|
49 |
|
|
40.83 |
% |
| Total |
|
|
748 |
|
|
730 |
|
|
|
18 |
|
|
2.47 |
% |
| Total noninterest income |
|
$ |
2,328 |
|
$ |
2,808 |
|
|
$ |
(480 |
) |
|
(17.09 |
)% |
|
|
|
|
|
|
|
|
|
| Memo items: |
|
|
|
|
|
|
|
|
| Residential mortgage operations |
|
$ |
674 |
|
$ |
1,246 |
|
|
|
(572 |
) |
|
(45.91 |
)% |
|
|
|
|
|
|
|
|
|
Residential Mortgage Operations
Residential mortgage operations includes net gains on sales of loans, net mortgage servicing rights income, and mortgage servicing fees.
Net gain on sales of loans represents the income earned on the sale of residential mortgage loans into the secondary market. Increases in interest rates and limited inventories have significantly driven down the volume of new originations and refinancing activity. Throughout 2022, the majority of residential mortgage loans originated were portfolio loans. As a result of selling fewer residential mortgage loans into the secondary market, we experienced reduced gains throughout the second half of 2022 and into 2023.
Changes in the fair value of MSR are highly correlated to changes in interest rates and prepayment speeds. As a significant portion of the serviced loan portfolio was originated at historically low interest rates, income recognized from the changes in the fair value of MSR have trended downward in recent quarters. While we experienced an increase in the first quarter of 2023, the overall direction of the fair value of MSR will likely continue to decline due to a reduction in the size of our servicing portfolio as a result of reduced levels of secondary market originations and prepayments. During the first quarter of 2023, the serviced loan portfolio declined by $11,000. We expect this trend to continue in future periods.
Mortgage servicing fees includes the fees earned for servicing loans that have been sold into the secondary market. The annual decrease in mortgage servicing fees is directly related to the size of the serviced portfolio. Due to reduced levels of secondary market originations and prepayments, the serviced loan portfolio declined by $52,624 since the first quarter of 2022. We expect mortgage servicing fees to trend modestly downward throughout 2023 due to decreased secondary market originations.
All Other Noninterest Income
Trust and investment services includes income earned from contracts with customers to manage assets for investment and/or to transact on their accounts through the wealth management and trust department. The increase in income during the first quarter of 2023 is a direct result of higher customer demand for annuity products. Trust services and wealth management fees are subject to market fluctuations and interest rate changes. We expect these fees to continue to increase throughout 2023.
ATM and debit card income represents fees earned on ATM and debit card transactions. We expect these fees to approximate current levels throughout 2023.
Service charges on deposit accounts includes fees earned from deposit customers for transaction-based charges, account maintenance and overdraft services. Service charges on deposit accounts are expected to approximate current levels throughout 2023.
Change in cash surrender value of corporate owned life insurance is expected to modestly increase throughout 2023.
Other includes miscellaneous other income items, none of which are individually significant.
Noninterest Expenses
|
|
Three Months Ended |
|
|
3/31/2023 |
|
12/31/2022 |
|
9/30/2022 |
|
6/30/2022 |
|
3/31/2022 |
| Compensation and benefits |
|
$ |
5,792 |
|
$ |
5,329 |
|
$ |
5,320 |
|
$ |
5,453 |
|
$ |
5,347 |
| Professional services |
|
|
766 |
|
|
594 |
|
|
763 |
|
|
777 |
|
|
812 |
| Furniture and equipment |
|
|
726 |
|
|
772 |
|
|
822 |
|
|
805 |
|
|
818 |
| Occupancy |
|
|
635 |
|
|
566 |
|
|
578 |
|
|
579 |
|
|
604 |
| Data processing |
|
|
513 |
|
|
111 |
|
|
363 |
|
|
665 |
|
|
412 |
| Advertising and promotional |
|
|
451 |
|
|
580 |
|
|
405 |
|
|
326 |
|
|
278 |
| Loan and collection |
|
|
240 |
|
|
278 |
|
|
435 |
|
|
600 |
|
|
327 |
| Other |
|
|
|
|
|
|
|
|
|
|
| FDIC insurance premiums |
|
|
201 |
|
|
149 |
|
|
150 |
|
|
172 |
|
|
150 |
| ATM and debit card |
|
|
161 |
|
|
254 |
|
|
154 |
|
|
160 |
|
|
143 |
| Telephone and communication |
|
|
119 |
|
|
110 |
|
|
112 |
|
|
112 |
|
|
105 |
| Amortization of core deposit intangibles |
|
|
76 |
|
|
107 |
|
|
108 |
|
|
107 |
|
|
108 |
| Other acquisition related expenses |
|
|
— |
|
|
— |
|
|
— |
|
|
14 |
|
|
256 |
| Other general and administrative |
|
|
953 |
|
|
931 |
|
|
933 |
|
|
790 |
|
|
807 |
| Total |
|
|
1,510 |
|
|
1,551 |
|
|
1,457 |
|
|
1,355 |
|
|
1,569 |
| Total noninterest expenses |
|
$ |
10,633 |
|
$ |
9,781 |
|
$ |
10,143 |
|
$ |
10,560 |
|
$ |
10,167 |
|
|
Three Months Ended
March 31 |
|
Variance |
|
|
2023 |
|
2022 |
|
Amount |
|
% |
| Compensation and benefits |
|
$ |
5,792 |
|
$ |
5,347 |
|
$ |
445 |
|
|
8.32 |
% |
| Professional services |
|
|
766 |
|
|
812 |
|
|
(46 |
) |
|
(5.67 |
)% |
| Furniture and equipment |
|
|
726 |
|
|
818 |
|
|
(92 |
) |
|
(11.25 |
)% |
| Occupancy |
|
|
635 |
|
|
604 |
|
|
31 |
|
|
5.13 |
% |
| Data processing |
|
|
513 |
|
|
412 |
|
|
101 |
|
|
24.51 |
% |
| Advertising and promotional |
|
|
451 |
|
|
278 |
|
|
173 |
|
|
62.23 |
% |
| Loan and collection |
|
|
240 |
|
|
327 |
|
|
(87 |
) |
|
(26.61 |
)% |
| Other |
|
|
|
|
|
|
|
|
| FDIC insurance premiums |
|
|
201 |
|
|
150 |
|
|
85 |
|
|
21.96 |
% |
| ATM and debit card |
|
|
161 |
|
|
143 |
|
|
18 |
|
|
12.59 |
% |
| Telephone and communication |
|
|
119 |
|
|
105 |
|
|
14 |
|
|
13.33 |
% |
| Amortization of core deposit intangibles |
|
|
76 |
|
|
108 |
|
|
(32 |
) |
|
(29.63 |
)% |
| Other acquisition related expenses |
|
|
— |
|
|
256 |
|
|
(256 |
) |
|
(100.00 |
)% |
| Other general and administrative |
|
|
953 |
|
|
807 |
|
|
146 |
|
|
18.09 |
% |
| Total |
|
|
1,510 |
|
|
1,569 |
|
|
(59 |
) |
|
(3.76 |
)% |
| Total noninterest expenses |
|
$ |
10,633 |
|
$ |
10,167 |
|
$ |
466 |
|
|
4.58 |
% |
|
|
|
|
|
|
|
|
|
Compensation and benefits includes salaries, commissions and incentives, employee benefits, and payroll taxes. Compensation and benefits increased in the first quarter of 2023 due to an increase in the size of the organization, merit increases, and market based adjustments. While there continues to be meaningful wage pressure, we expect a modest increase in overall compensation and benefits due to merit increases and market based adjustments. These increases will be partially offset by decreases in commissions as loan originations in the first quarter of 2023 declined from elevated levels experienced in 2022. This trend is expected to continue throughout 2023.
Professional services include expenses relating to third-party professional services. These services include, but are not limited to, regulatory, auditing, consulting, and legal. The decline in these expenses during the fourth quarter of 2022 is primarily due to a decrease in audit fees. Professional services expenses are expected to increase slightly in 2023.
Furniture and equipment and occupancy expenses primarily consist of depreciation, repairs and maintenance, certain service contracts, and other related items. These expenses are expected to approximate current levels in 2023.
Data processing primarily includes the expenses relating to our core data processor. These expenses trended downward during the third and fourth quarters of 2022 due to receipt of renewal incentives from our core data processor. Data processing expenses are expected to normalize in 2023 as these renewal incentives wind down.
Advertising and promotional includes media costs and any donations or sponsorships. The annual increase in such expenses is a result of enhanced marketing efforts to attract new and expand existing customer loan and deposit account relationships. Total advertising and promotional expenses are expected to moderately increase during 2023.
Loan and collection includes expenses related to the origination and collection of loans. These expenses are expected to decline in future periods as loan growth is expected to moderate throughout 2023.
FDIC insurance premiums typically fluctuate each period based on the size of the balance sheet, capital position and overall risk profile. FDIC insurance premiums are expected to increase in 2023 primarily due to the FDIC increasing its assessment rate for all insured institutions effective January 1, 2023.
ATM and debit card expenses fluctuate based on customer and non-customer utilization of ATMs and customer debit card volumes. The increase in ATM and debit card expenses during the fourth quarter of 2022 is due to an increase in customer disputes resulting from fraudulent debit card activity. We expect these fees to approximate current levels in 2023.
Telephone and communication includes expenses relating to our communication systems. These expenses are expected to approximate current levels during 2023.
Amortization of core deposit intangibles relates to the core deposits acquired from Community Bancorp, Inc. on December 31, 2016 and FSB on December 1, 2021. These core deposit intangibles are being amortized using an accelerated sum-of-years-digits method over their estimated useful lives of seven years.
Other acquisition related expenses includes expenses incurred during the first half of 2022 related to the acquisition of FSB. We do not anticipate recording additional acquisition expenses in future periods.
Other general and administrative includes miscellaneous other expense items, none of which are individually significant. Other general and administrative expenses are expected to increase slightly in future periods.
Balance Sheet Breakdown and Analysis
|
|
3/31/2023 |
|
12/31/2022 |
|
9/30/2022 |
|
6/30/2022 |
|
3/31/2022 |
| ASSETS |
|
|
|
|
|
|
|
|
|
|
| Cash and due from banks |
|
$ |
100,496 |
|
$ |
57,844 |
|
$ |
43,345 |
|
$ |
38,510 |
|
$ |
80,133 |
| Total investment securities |
|
|
122,995 |
|
|
125,049 |
|
|
129,886 |
|
|
136,725 |
|
|
151,579 |
| Residential mortgage loans held-for-sale, at fair value |
|
|
875 |
|
|
493 |
|
|
62 |
|
|
664 |
|
|
3,038 |
| Gross loans |
|
|
1,457,173 |
|
|
1,436,166 |
|
|
1,350,851 |
|
|
1,232,892 |
|
|
1,139,351 |
| Less allowance for credit losses |
|
|
15,220 |
|
|
13,000 |
|
|
12,200 |
|
|
11,000 |
|
|
11,000 |
| Net loans |
|
|
1,441,953 |
|
|
1,423,166 |
|
|
1,338,651 |
|
|
1,221,892 |
|
|
1,128,351 |
| All other assets |
|
|
82,754 |
|
|
82,311 |
|
|
76,648 |
|
|
73,663 |
|
|
72,384 |
| Total assets |
|
$ |
1,749,073 |
|
$ |
1,688,863 |
|
$ |
1,588,592 |
|
$ |
1,471,454 |
|
$ |
1,435,485 |
|
|
. |
|
|
|
|
|
|
|
|
| LIABILITIES AND SHAREHOLDERS’ EQUITY |
|
|
|
|
|
|
|
|
|
|
| Total deposits |
|
$ |
1,353,918 |
|
$ |
1,332,883 |
|
$ |
1,345,209 |
|
$ |
1,231,543 |
|
$ |
1,252,892 |
| Total borrowed funds |
|
|
259,050 |
|
|
222,350 |
|
|
116,600 |
|
|
111,000 |
|
|
52,000 |
| Accrued interest payable and other liabilities |
|
|
7,858 |
|
|
7,543 |
|
|
5,153 |
|
|
10,345 |
|
|
9,247 |
| Total liabilities |
|
|
1,620,826 |
|
|
1,562,776 |
|
|
1,466,962 |
|
|
1,352,888 |
|
|
1,314,139 |
| Total shareholders’ equity |
|
|
128,247 |
|
|
126,087 |
|
|
121,630 |
|
|
118,566 |
|
|
121,346 |
| Total liabilities and shareholders’ equity |
|
$ |
1,749,073 |
|
$ |
1,688,863 |
|
$ |
1,588,592 |
|
$ |
1,471,454 |
|
$ |
1,435,485 |
|
|
3/31/2023 vs 12/31/2022 |
|
3/31/2023 vs 3/31/2022 |
|
|
Variance |
|
Variance |
|
|
Amount |
|
% |
|
Amount |
|
% |
| ASSETS |
|
|
|
|
|
|
|
|
| Cash and due from banks |
|
$ |
42,652 |
|
|
73.74 |
% |
|
$ |
20,363 |
|
|
25.41 |
% |
| Total investment securities |
|
|
(2,054 |
) |
|
(1.64 |
)% |
|
|
(28,584 |
) |
|
(18.86 |
)% |
| Residential mortgage loans held-for-sale, at fair value |
|
|
382 |
|
|
77.48 |
% |
|
|
(2,163 |
) |
|
(71.20 |
)% |
| Gross loans |
|
|
21,007 |
|
|
1.46 |
% |
|
|
317,822 |
|
|
27.90 |
% |
| Less allowance for credit losses |
|
|
2,220 |
|
|
17.08 |
% |
|
|
4,220 |
|
|
38.36 |
% |
| Net loans |
|
|
18,787 |
|
|
1.32 |
% |
|
|
313,602 |
|
|
27.79 |
% |
| All other assets |
|
|
443 |
|
|
0.54 |
% |
|
|
10,370 |
|
|
14.33 |
% |
| Total assets |
|
$ |
60,210 |
|
|
3.57 |
% |
|
$ |
313,588 |
|
|
21.85 |
% |
|
|
|
|
|
|
|
|
|
| LIABILITIES AND SHAREHOLDERS’ EQUITY |
|
|
|
|
|
|
|
|
| Total deposits |
|
$ |
21,035 |
|
|
1.58 |
% |
|
$ |
101,026 |
|
|
8.06 |
% |
| Total borrowed funds |
|
|
36,700 |
|
|
16.51 |
% |
|
|
207,050 |
|
|
398.17 |
% |
| Accrued interest payable and other liabilities |
|
|
315 |
|
|
4.18 |
% |
|
|
(1,389 |
) |
|
(15.02 |
)% |
| Total liabilities |
|
|
58,050 |
|
|
3.71 |
% |
|
|
306,687 |
|
|
23.34 |
% |
| Total shareholders’ equity |
|
|
2,160 |
|
|
1.71 |
% |
|
|
6,901 |
|
|
5.69 |
% |
| Total liabilities and shareholders’ equity |
|
$ |
60,210 |
|
|
3.57 |
% |
|
$ |
313,588 |
|
|
21.85 |
% |
|
|
|
|
|
|
|
|
|
Cash and due from banks
|
|
3/31/2023 |
|
12/31/2022 |
|
9/30/2022 |
|
6/30/2022 |
|
3/31/2022 |
| Cash and due from banks |
|
|
|
|
|
|
|
|
|
|
| Noninterest bearing |
|
$ |
24,376 |
|
|
$ |
28,216 |
|
|
$ |
29,530 |
|
$ |
26,085 |
|
$ |
23,715 |
|
| Interest bearing |
|
|
76,120 |
|
|
|
29,628 |
|
|
|
13,815 |
|
|
12,425 |
|
|
56,418 |
|
| Total |
|
$ |
100,496 |
|
|
$ |
57,844 |
|
|
$ |
43,345 |
|
$ |
38,510 |
|
$ |
80,133 |
|
|
|
|
|
|
|
|
|
|
|
|
|
|
3/31/2023 vs 12/31/2022 |
|
|
|
3/31/2023 vs 3/31/2022 |
|
|
Variance |
|
|
|
Variance |
|
|
Amount |
|
% |
|
|
|
Amount |
|
% |
| Cash and due from banks |
|
|
|
|
|
|
|
|
|
|
| Noninterest bearing |
|
$ |
(3,840 |
) |
|
(13.61 |
)% |
|
|
|
$ |
661 |
|
|
2.79 |
% |
| Interest bearing |
|
|
46,492 |
|
|
|
156.92 |
% |
|
|
|
|
19,702 |
|
|
34.92 |
% |
| Total |
|
$ |
42,652 |
|
|
|
73.74 |
% |
|
|
|
$ |
20,363 |
|
|
25.41 |
% |
|
|
|
|
|
|
|
|
|
|
|
Cash and due from banks fluctuates from period to period based on loan demand and variances in deposit account balances.
Primary and secondary liquidity sources
The following table outlines our primary and secondary sources of liquidity as of:
|
|
3/31/2023 |
|
12/31/2022 |
|
9/30/2022 |
|
6/30/2022 |
|
3/31/2022 |
| Cash and cash equivalents |
|
$ |
100,496 |
|
$ |
57,844 |
|
$ |
43,345 |
|
$ |
38,510 |
|
$ |
80,133 |
| Fair value of unpledged investment securities |
|
|
102,368 |
|
|
103,819 |
|
|
109,685 |
|
|
115,586 |
|
|
132,364 |
| FHLB borrowing availability |
|
|
111,500 |
|
|
144,567 |
|
|
78,000 |
|
|
83,000 |
|
|
140,000 |
| Unsecured lines of credit |
|
|
20,000 |
|
|
26,500 |
|
|
26,500 |
|
|
26,500 |
|
|
26,500 |
| Funds available through the Fed Discount Window |
|
|
119 |
|
|
113 |
|
|
115 |
|
|
125 |
|
|
125 |
| Parent company line of credit |
|
|
1,450 |
|
|
1,650 |
|
|
2,400 |
|
|
3,000 |
|
|
5,000 |
| PPPLF |
|
|
— |
|
|
— |
|
|
— |
|
|
429 |
|
|
583 |
| Total liquidity sources |
|
$ |
335,933 |
|
$ |
334,493 |
|
$ |
260,045 |
|
$ |
267,150 |
|
$ |
384,705 |
|
|
|
|
|
|
|
|
|
|
|
The increase in cash and cash equivalents during the first quarter of 2023 was due to our utilization of wholesale funding (see “Wholesale funding sources”below). The increase in FHLB borrowing availability during the fourth quarter of 2022 was due to approval from the FHLB to allow us to pledge eligible commercial real estate loans. During the first quarter of 2023, our FHLB borrowing availability declined due to our utilization of additional FHLB advances. Due to market conditions in the Banking Industry during the first quarter of 2023, Zions Correspondent Banking has limited Fed Funds line advances to secured arrangements only and will continue to do so for the foreseeable future. As such, our unsecured lines of credit declined by $6,500 during the first quarter of 2023.
In addition to the above liquidity sources, we also have the option of utilizing wholesale funding sources, such as brokered NOW accounts, brokered time deposits and internet time deposits. Although wholesale funding sources are typically more expensive than core deposits and other liquidity sources, they are an integral part of our funding.
Investment securities
|
|
3/31/2023 |
|
12/31/2022 |
|
9/30/2022 |
|
6/30/2022 |
|
3/31/2022 |
| Available-for-sale |
|
|
|
|
|
|
|
|
|
|
| U.S. Government and federal agency |
|
$ |
24,402 |
|
|
$ |
24,394 |
|
|
$ |
26,391 |
|
|
$ |
27,391 |
|
|
$ |
28,396 |
|
| State and municipal |
|
|
22,649 |
|
|
|
22,709 |
|
|
|
22,743 |
|
|
|
22,863 |
|
|
|
24,949 |
|
| Mortgage backed residential |
|
|
54,595 |
|
|
|
56,293 |
|
|
|
58,313 |
|
|
|
60,672 |
|
|
|
63,532 |
|
| Certificates of deposit |
|
|
7,426 |
|
|
|
7,426 |
|
|
|
8,166 |
|
|
|
8,914 |
|
|
|
9,917 |
|
| Collateralized mortgage obligations - agencies |
|
|
25,275 |
|
|
|
25,925 |
|
|
|
26,560 |
|
|
|
27,733 |
|
|
|
28,968 |
|
| Unrealized gain/(loss) on available-for-sale securities |
|
|
(13,940 |
) |
|
|
(14,184 |
) |
|
|
(14,698 |
) |
|
|
(13,509 |
) |
|
|
(6,900 |
) |
| Total available-for-sale |
|
|
120,407 |
|
|
|
122,563 |
|
|
|
127,475 |
|
|
|
134,064 |
|
|
|
148,862 |
|
| Held-to-maturity state and municipal |
|
|
1,168 |
|
|
|
1,171 |
|
|
|
1,173 |
|
|
|
1,386 |
|
|
|
1,509 |
|
| Equity securities |
|
|
1,420 |
|
|
|
1,315 |
|
|
|
1,238 |
|
|
|
1,275 |
|
|
|
1,208 |
|
| Total investment securities |
|
$ |
122,995 |
|
|
$ |
125,049 |
|
|
$ |
129,886 |
|
|
$ |
136,725 |
|
|
$ |
151,579 |
|
|
|
|
|
|
|
|
|
|
|
|
|
|
3/31/2023 vs 12/31/2022 |
|
|
|
3/31/2023 vs 3/31/2022 |
|
|
Variance |
|
|
|
Variance |
|
|
Amount |
|
% |
|
|
|
Amount |
|
% |
| Available-for-sale |
|
|
|
|
|
|
|
|
|
|
| U.S. Government and federal agency |
|
|
8 |
|
|
|
0.03 |
% |
|
|
|
$ |
(3,994 |
) |
|
(14.07 |
)% |
| State and municipal |
|
|
(60 |
) |
|
(0.26 |
)% |
|
|
|
|
(2,300 |
) |
|
(9.22 |
)% |
| Mortgage backed residential |
|
|
(1,698 |
) |
|
(3.02 |
)% |
|
|
|
|
(8,937 |
) |
|
(14.07 |
)% |
| Certificates of deposit |
|
|
— |
|
|
|
— |
% |
|
|
|
|
(2,491 |
) |
|
(25.12 |
)% |
| Collateralized mortgage obligations - agencies |
|
|
(650 |
) |
|
(2.51 |
)% |
|
|
|
|
(3,693 |
) |
|
(12.75 |
)% |
| Unrealized gain/(loss) on available-for-sale securities |
|
|
244 |
|
|
(1.72 |
)% |
|
|
|
|
(7,040 |
) |
|
|
102.03 |
% |
| Total available-for-sale |
|
|
(2,156 |
) |
|
(1.76 |
)% |
|
|
|
|
(28,455 |
) |
|
(19.12 |
)% |
| Held-to-maturity state and municipal |
|
|
(3 |
) |
|
(0.26 |
)% |
|
|
|
|
(341 |
) |
|
(22.60 |
)% |
| Equity securities |
|
|
105 |
|
|
|
7.98 |
% |
|
|
|
|
212 |
|
|
|
17.55 |
% |
| Total investment securities |
|
$ |
(2,054 |
) |
|
(1.64 |
)% |
|
|
|
$ |
(28,584 |
) |
|
(18.86 |
)% |
|
|
|
|
|
|
|
|
|
|
|
The amortized cost and fair value of AFS investment securities as of March 31, 2023 were as follows:
|
|
Maturing |
|
|
|
|
|
|
Due in One Year or Less |
|
After One Year But Within Five Years |
|
After Five Years But Within Ten Years |
|
After Ten Years |
|
Securities with Variable Monthly Payments or Noncontractual Maturities |
|
Total |
| U.S. Government and federal agency |
|
$ |
6,523 |
|
$ |
17,879 |
|
$ |
— |
|
$ |
— |
|
$ |
— |
|
$ |
24,402 |
| State and municipal |
|
|
3,342 |
|
|
16,639 |
|
|
1,287 |
|
|
1,381 |
|
|
— |
|
|
22,649 |
| Mortgage backed residential |
|
|
— |
|
|
|
|
|
|
|
|
54,595 |
|
|
54,595 |
| Certificates of deposit |
|
|
5,452 |
|
|
1,974 |
|
|
— |
|
|
— |
|
|
— |
|
|
7,426 |
| Collateralized mortgage obligations - agencies |
|
|
— |
|
|
— |
|
|
— |
|
|
— |
|
|
25,275 |
|
|
25,275 |
| Total amortized cost |
|
$ |
15,317 |
|
$ |
36,492 |
|
$ |
1,287 |
|
$ |
1,381 |
|
$ |
79,870 |
|
$ |
134,347 |
| Fair value |
|
$ |
14,965 |
|
$ |
33,346 |
|
$ |
1,176 |
|
$ |
1,273 |
|
$ |
69,647 |
|
$ |
120,407 |
|
|
|
|
|
|
|
|
|
|
|
|
|
The amortized cost and fair value of HTM investment securities as of March 31, 2023 were as follows:
|
|
Maturing |
|
|
|
|
|
|
Due in One Year or Less |
|
After One Year But Within Five Years |
|
After Five Years But Within Ten Years |
|
After Ten Years |
|
Securities with Variable Monthly Payments or Noncontractual Maturities |
|
Total |
| State and municipal |
|
$ |
633 |
|
$ |
305 |
|
$ |
230 |
|
$ |
— |
|
$ |
— |
|
$ |
1,168 |
| Fair value |
|
$ |
629 |
|
$ |
298 |
|
$ |
226 |
|
$ |
— |
|
$ |
— |
|
$ |
1,153 |
|
|
|
|
|
|
|
|
|
|
|
|
|
Residential mortgage loans held-for-sale, at fair value
Loans HFS represent the fair value of loans that have been committed to be sold to the secondary market, but have not yet been delivered. The level of loans HFS fluctuates based on loan demand as well as the timing of loan deliveries to the secondary market. Overall, our level of loans HFS has declined year-over-year as a result of increases in market interest rates and lack of residential inventory.
Loans and allowance for credit losses
As outlined in the following tables, our loan portfolio has grown substantially throughout the past 12 months, primarily in the commercial real estate and residential mortgage segments. However, due to current market conditions, we expect loan demand to decline during 2023. Specifically, our commercial pipeline has declined significantly since December 31, 2022, and the requests that are being presented are lower dollar balances and often carry an SBA guarantee. Our allowance for credit losses increased $2,000 during the first quarter of 2023 as a result of the adoption of ASU 2016-13, “Financial Instruments - Credit Losses (Topic 326): Measurement of Credit Losses on Financial Instruments” on January 1, 2023. This was recorded as a cumulative-effect adjustment, net of tax, from retained earnings.
The following tables outline the composition and changes in the loan portfolio as of:
|
|
3/31/2023 |
|
12/31/2022 |
|
9/30/2022 |
|
6/30/2022 |
|
3/31/2022 |
| Commercial, net of PPP loans |
|
$ |
111,557 |
|
|
$ |
106,616 |
|
|
$ |
107,531 |
|
|
$ |
108,054 |
|
|
$ |
94,810 |
|
| PPP loans |
|
|
— |
|
|
|
— |
|
|
|
— |
|
|
|
429 |
|
|
|
583 |
|
| Commercial real estate |
|
|
874,690 |
|
|
|
869,496 |
|
|
|
820,165 |
|
|
|
745,416 |
|
|
|
698,275 |
|
| Total commercial loans |
|
|
986,247 |
|
|
|
976,112 |
|
|
|
927,696 |
|
|
|
853,899 |
|
|
|
793,668 |
|
| Residential mortgage |
|
|
418,987 |
|
|
|
406,408 |
|
|
|
368,971 |
|
|
|
327,574 |
|
|
|
297,940 |
|
| Home equity |
|
|
46,909 |
|
|
|
47,768 |
|
|
|
47,928 |
|
|
|
44,648 |
|
|
|
40,609 |
|
| Total residential real estate loans |
|
|
465,896 |
|
|
|
454,176 |
|
|
|
416,899 |
|
|
|
372,222 |
|
|
|
338,549 |
|
| Consumer |
|
|
5,030 |
|
|
|
5,878 |
|
|
|
6,256 |
|
|
|
6,771 |
|
|
|
7,134 |
|
| Gross loans |
|
|
1,457,173 |
|
|
|
1,436,166 |
|
|
|
1,350,851 |
|
|
|
1,232,892 |
|
|
|
1,139,351 |
|
| Allowance for credit losses |
|
|
(15,220 |
) |
|
|
(13,000 |
) |
|
|
(12,200 |
) |
|
|
(11,000 |
) |
|
|
(11,000 |
) |
| Loans, net |
|
$ |
1,441,953 |
|
|
$ |
1,423,166 |
|
|
$ |
1,338,651 |
|
|
$ |
1,221,892 |
|
|
$ |
1,128,351 |
|
|
|
|
|
|
|
|
|
|
|
|
| Memo items: |
|
|
|
|
|
|
|
|
|
|
| Gross loans, net of PPP loans |
|
$ |
1,457,173 |
|
|
$ |
1,436,166 |
|
|
$ |
1,350,851 |
|
|
$ |
1,232,463 |
|
|
$ |
1,138,768 |
|
| Residential mortgage loans serviced for others |
|
$ |
636,121 |
|
|
$ |
647,121 |
|
|
$ |
660,490 |
|
|
$ |
678,117 |
|
|
$ |
688,745 |
|
|
|
|
|
|
|
|
|
|
|
|
|
|
3/31/2023 vs 12/31/2022 |
|
|
|
3/31/2023 vs 3/31/2022 |
|
|
Variance |
|
|
|
Variance |
|
|
Amount |
|
% |
|
|
|
Amount |
|
% |
| Commercial, net of PPP loans |
|
$ |
4,941 |
|
|
|
4.63 |
% |
|
|
|
$ |
16,747 |
|
|
|
17.66 |
% |
| PPP loans |
|
|
— |
|
|
N/M |
|
|
|
|
(583 |
) |
|
(100.00 |
)% |
| Commercial real estate |
|
|
5,194 |
|
|
|
0.60 |
% |
|
|
|
|
176,415 |
|
|
|
25.26 |
% |
| Total commercial loans |
|
|
10,135 |
|
|
|
1.04 |
% |
|
|
|
|
192,579 |
|
|
|
24.26 |
% |
| Residential mortgage |
|
|
12,579 |
|
|
|
3.10 |
% |
|
|
|
|
121,047 |
|
|
|
40.63 |
% |
| Home equity |
|
|
(859 |
) |
|
(1.80 |
)% |
|
|
|
|
6,300 |
|
|
|
15.51 |
% |
| Total residential real estate loans |
|
|
11,720 |
|
|
|
2.58 |
% |
|
|
|
|
127,347 |
|
|
|
37.62 |
% |
| Consumer |
|
|
(848 |
) |
|
(14.43 |
)% |
|
|
|
|
(2,104 |
) |
|
(29.49 |
)% |
| Gross loans |
|
|
21,007 |
|
|
|
1.46 |
% |
|
|
|
|
317,822 |
|
|
|
27.90 |
% |
| Allowance for credit losses |
|
|
(2,220 |
) |
|
|
17.08 |
% |
|
|
|
|
(4,220 |
) |
|
|
38.36 |
% |
| Loans, net |
|
$ |
18,787 |
|
|
|
1.32 |
% |
|
|
|
$ |
313,602 |
|
|
|
27.79 |
% |
|
|
|
|
|
|
|
|
|
|
|
| Memo items: |
|
|
|
|
|
|
|
|
|
|
| Gross loans, net of PPP loans |
|
$ |
21,007 |
|
|
|
1.46 |
% |
|
|
|
$ |
318,405 |
|
|
|
27.96 |
% |
| Residential mortgage loans serviced for others |
|
$ |
(11,000 |
) |
|
(1.70 |
)% |
|
|
|
$ |
(52,624 |
) |
|
(7.64 |
)% |
|
|
|
|
|
|
|
|
|
|
|
The following table presents historical loan balances by portfolio segment and impairment evaluation as of:
|
|
3/31/2023 |
|
12/31/2022 |
|
9/30/2022 |
|
6/30/2022 |
|
3/31/2022 |
| Loans collectively evaluated for impairment |
|
|
|
|
|
|
|
|
|
|
| Commercial and industrial |
|
$ |
111,426 |
|
$ |
106,616 |
|
$ |
107,531 |
|
$ |
108,483 |
|
$ |
94,899 |
| Commercial real estate |
|
|
874,509 |
|
|
869,313 |
|
|
819,982 |
|
|
745,025 |
|
|
697,818 |
| Residential mortgage |
|
|
416,879 |
|
|
404,308 |
|
|
367,652 |
|
|
326,481 |
|
|
296,883 |
| Home equity |
|
|
46,761 |
|
|
47,728 |
|
|
47,887 |
|
|
44,607 |
|
|
40,568 |
| Consumer |
|
|
5,020 |
|
|
5,871 |
|
|
6,251 |
|
|
6,771 |
|
|
7,134 |
| Subtotal |
|
|
1,454,595 |
|
|
1,433,836 |
|
|
1,349,303 |
|
|
1,231,367 |
|
|
1,137,302 |
| Loans individually evaluated for impairment |
|
|
|
|
|
|
|
|
|
|
| Commercial and industrial |
|
|
131 |
|
|
— |
|
|
— |
|
|
— |
|
|
494 |
| Commercial real estate |
|
|
181 |
|
|
183 |
|
|
183 |
|
|
391 |
|
|
457 |
| Residential mortgage |
|
|
2,108 |
|
|
2,100 |
|
|
1,319 |
|
|
1,093 |
|
|
1,057 |
| Home equity |
|
|
148 |
|
|
40 |
|
|
41 |
|
|
41 |
|
|
41 |
| Consumer |
|
|
10 |
|
|
7 |
|
|
5 |
|
|
— |
|
|
— |
| Subtotal |
|
|
2,578 |
|
|
2,330 |
|
|
1,548 |
|
|
1,525 |
|
|
2,049 |
| Gross Loans |
|
$ |
1,457,173 |
|
$ |
1,436,166 |
|
$ |
1,350,851 |
|
$ |
1,232,892 |
|
$ |
1,139,351 |
|
|
|
|
|
|
|
|
|
|
|
The following table presents historical allowance for credit losses allocations by portfolio segment and impairment evaluation as of:
|
|
3/31/2023 |
|
12/31/2022 |
|
9/30/2022 |
|
6/30/2022 |
|
3/31/2022 |
| Loans collectively evaluated for impairment |
|
|
|
|
|
|
|
|
|
|
| Commercial and industrial |
|
$ |
1,324 |
|
$ |
1,094 |
|
$ |
1,129 |
|
$ |
1,074 |
|
$ |
837 |
| Commercial real estate |
|
|
8,765 |
|
|
7,480 |
|
|
7,126 |
|
|
6,437 |
|
|
6,716 |
| Residential mortgage |
|
|
4,576 |
|
|
3,878 |
|
|
3,458 |
|
|
3,061 |
|
|
3,007 |
| Home equity |
|
|
416 |
|
|
370 |
|
|
370 |
|
|
345 |
|
|
364 |
| Consumer |
|
|
49 |
|
|
128 |
|
|
90 |
|
|
74 |
|
|
63 |
| Subtotal |
|
|
15,130 |
|
|
12,950 |
|
|
12,173 |
|
|
10,991 |
|
|
10,987 |
| Loans individually evaluated for impairment |
|
|
|
|
|
|
|
|
|
|
| Commercial and industrial |
|
|
3 |
|
|
— |
|
|
— |
|
|
— |
|
|
— |
| Commercial real estate |
|
|
— |
|
|
— |
|
|
— |
|
|
— |
|
|
— |
| Residential mortgage |
|
|
77 |
|
|
43 |
|
|
27 |
|
|
9 |
|
|
13 |
| Home equity |
|
|
— |
|
|
— |
|
|
— |
|
|
— |
|
|
— |
| Consumer |
|
|
10 |
|
|
7 |
|
|
— |
|
|
— |
|
|
— |
| Subtotal |
|
|
90 |
|
|
50 |
|
|
27 |
|
|
9 |
|
|
13 |
| Allowance for credit losses |
|
$ |
15,220 |
|
$ |
13,000 |
|
$ |
12,200 |
|
$ |
11,000 |
|
$ |
11,000 |
|
|
|
|
|
|
|
|
|
|
|
| Commercial and industrial |
|
$ |
1,327 |
|
$ |
1,094 |
|
$ |
1,129 |
|
$ |
1,074 |
|
$ |
837 |
| Commercial real estate |
|
|
8,765 |
|
|
7,480 |
|
|
7,126 |
|
|
6,437 |
|
|
6,716 |
| Residential mortgage |
|
|
4,653 |
|
|
3,921 |
|
|
3,485 |
|
|
3,070 |
|
|
3,020 |
| Home equity |
|
|
416 |
|
|
370 |
|
|
370 |
|
|
345 |
|
|
364 |
| Consumer |
|
|
59 |
|
|
135 |
|
|
90 |
|
|
74 |
|
|
63 |
| Allowance for credit losses |
|
$ |
15,220 |
|
$ |
13,000 |
|
$ |
12,200 |
|
$ |
11,000 |
|
$ |
11,000 |
|
|
|
|
|
|
|
|
|
|
|
Loan concentration analysis
As a result of the current economic conditions, there continues to be a heightened focus in the financial industry for non-owner occupied commercial real estate loans, most specifically retail and office space industries. We continue to monitor various industries that have been impacted by the pandemic but we will now shift attention to new concerns associated with inflation, supply chain disruption, rising interest rates, and office space usage associated with an increased remote workforce. The overall non-owner occupied commercial real estate loan portfolio has remained solid, and performance has not been lacking. Performance is based on debt service coverage ratio, loan to value ratio and payment trends. As of March 31, 2023, delinquencies in the non-owner occupied commercial real estate loan portfolio continue to remain minimal, as only one loan was included in our 30-89 days past due category in the office pool for $180. We expect loan demand in the non-owner occupied commercial real estate loan portfolio to experience insignificant growth, if any, in future periods.
The net lease pool is one of the largest growth pools in the non-owner occupied commercial real estate portfolio and continues to remain strong. Risk associated within this pool is minimal as these are national or regional tenants that are well vetted during origination and annually thereafter. Risk is further minimized in this pool as locations are spread out nationally.
Due to the ongoing pressures on the office sector due to remote work capabilities and less required office space, we continue to monitor the office pool more closely for potential deterioration. It is not expected that there will be much, if any, impact on portfolio performance in this pool in the near future due to existing lease terms, tenant mix, office size, and strong underwriting at origination.
Below is a description of each industry pool within the non-owner occupied commercial real estate loan portfolio:
Net lease: Loans in this pool represent national credit tenants (or franchisees of the same) or large regional tenants with excellent credit. These loans are typically single tenant net lease credits with strong debt service coverage ratios and lease terms that extend beyond the maturity of the loan.
Retail strip centers: Loans in this pool represent loans collateralized by retail strip centers. The tenant base within this pool consists primarily of retail space whose average lease periods run between one and ten years. Larger strip centers are usually anchored by a national or regional tenant. Guarantors in this category typically have large liquid reserves.
Office: Loans in this pool represent loans collateralized by non-owner occupied office buildings. The tenant base includes legal and other professional services whose average lease periods run from three to fifteen years.
Special use: Loans in this pool represent loans collateralized by special use buildings, which include hotels, motels, assisted living and nursing homes that are not classified as construction or SBA loans.
Medical office: Loans in this pool represent loans collateralized by non-owner occupied medical office buildings. The tenant base includes medical services whose average lease periods run from three to fifteen years.
Industrial: Loans in pool represent investment properties used for manufacturing and production.
Self storage: Loans in this pool represent self storage buildings. Loan terms are generally five years or less and the lease terms of the units are typically on a month-to-month basis.
Mixed use: Loans in this pool represent loans collateralized by mixed use real estate. The tenant base within this pool consists primarily of office-retail, office-residential or retail-residential space. The properties are most often purchased by individuals for investment purposes.
Retail: Loans in this pool represent loans collateralized by single tenant retail buildings whose average lease periods run over five years.
The following tables present the composition of current and historical non-owner occupied commercial real estate loans, based on loan collateral, by industry pool:
|
|
3/31/2023 |
|
12/31/2022 |
|
9/30/2022 |
|
6/30/2022 |
|
3/31/2022 |
| Net lease |
|
$ |
161,392 |
|
|
$ |
165,848 |
|
|
$ |
160,453 |
|
$ |
162,424 |
|
|
$ |
158,862 |
|
| Retail strip centers |
|
|
95,726 |
|
|
|
89,671 |
|
|
|
85,050 |
|
|
69,598 |
|
|
|
47,833 |
|
| Office |
|
|
59,867 |
|
|
|
60,166 |
|
|
|
58,997 |
|
|
42,556 |
|
|
|
42,724 |
|
| Special use |
|
|
41,932 |
|
|
|
35,284 |
|
|
|
25,289 |
|
|
26,576 |
|
|
|
28,889 |
|
| Medical office |
|
|
30,363 |
|
|
|
30,305 |
|
|
|
29,679 |
|
|
26,890 |
|
|
|
19,231 |
|
| Industrial |
|
|
29,025 |
|
|
|
30,396 |
|
|
|
32,222 |
|
|
28,235 |
|
|
|
25,389 |
|
| Self storage |
|
|
22,265 |
|
|
|
22,285 |
|
|
|
22,467 |
|
|
10,736 |
|
|
|
10,804 |
|
| Mixed use |
|
|
19,054 |
|
|
|
19,208 |
|
|
|
19,405 |
|
|
16,520 |
|
|
|
14,655 |
|
| Retail |
|
|
17,429 |
|
|
|
15,437 |
|
|
|
15,279 |
|
|
13,597 |
|
|
|
17,610 |
|
|
|
|
|
|
|
|
|
|
|
|
| Total non-owner occupied commercial loans |
|
$ |
477,053 |
|
|
$ |
468,600 |
|
|
$ |
448,841 |
|
$ |
397,132 |
|
|
$ |
365,997 |
|
|
|
|
|
|
|
|
|
|
|
|
|
|
3/31/2023 vs 12/31/2022 |
|
|
|
3/31/2023 vs 3/31/2022 |
|
|
Variance |
|
|
|
Variance |
|
|
Amount |
|
% |
|
|
|
Amount |
|
% |
| Net lease |
|
$ |
(4,456 |
) |
|
(2.69 |
)% |
|
|
|
$ |
2,530 |
|
|
|
1.59 |
% |
| Retail strip centers |
|
|
6,055 |
|
|
|
6.75 |
% |
|
|
|
|
47,893 |
|
|
|
100.13 |
% |
| Office |
|
|
(299 |
) |
|
(0.50 |
)% |
|
|
|
|
17,143 |
|
|
|
40.12 |
% |
| Special use |
|
|
6,648 |
|
|
|
18.84 |
% |
|
|
|
|
13,043 |
|
|
|
45.15 |
% |
| Medical office |
|
|
58 |
|
|
|
0.19 |
% |
|
|
|
|
11,132 |
|
|
|
57.89 |
% |
| Industrial |
|
|
(1,371 |
) |
|
(4.51 |
)% |
|
|
|
|
3,636 |
|
|
|
14.32 |
% |
| Self storage |
|
|
(20 |
) |
|
(0.09 |
)% |
|
|
|
|
11,461 |
|
|
|
106.08 |
% |
| Mixed use |
|
|
(154 |
) |
|
(0.80 |
)% |
|
|
|
|
4,399 |
|
|
|
30.02 |
% |
| Retail |
|
|
1,992 |
|
|
|
12.90 |
% |
|
|
|
|
(181 |
) |
|
(1.03 |
)% |
|
|
|
|
|
|
|
|
|
|
|
| Total non-owner occupied commercial loans |
|
$ |
8,453 |
|
|
|
1.80 |
% |
|
|
|
$ |
111,056 |
|
|
|
30.34 |
% |
|
|
|
|
|
|
|
|
|
|
|
The following table presents current and historical non-owner occupied commercial real estate loans by industry as a percentage of gross loans:
|
|
3/31/2023 |
|
12/31/2022 |
|
9/30/2022 |
|
6/30/2022 |
|
3/31/2022 |
| Net lease |
|
11.08 |
% |
|
11.55 |
% |
|
11.88 |
% |
|
13.17 |
% |
|
13.94 |
% |
| Retail strip centers |
|
6.57 |
% |
|
6.24 |
% |
|
6.30 |
% |
|
5.65 |
% |
|
4.20 |
% |
| Office |
|
4.11 |
% |
|
4.19 |
% |
|
4.37 |
% |
|
3.45 |
% |
|
3.75 |
% |
| Special use |
|
2.88 |
% |
|
2.46 |
% |
|
1.87 |
% |
|
2.16 |
% |
|
2.54 |
% |
| Medical office |
|
2.08 |
% |
|
2.11 |
% |
|
2.20 |
% |
|
2.18 |
% |
|
1.69 |
% |
| Industrial |
|
1.99 |
% |
|
2.12 |
% |
|
2.39 |
% |
|
2.29 |
% |
|
2.23 |
% |
| Self storage |
|
1.53 |
% |
|
1.55 |
% |
|
1.66 |
% |
|
0.87 |
% |
|
0.95 |
% |
| Mixed use |
|
1.31 |
% |
|
1.34 |
% |
|
1.44 |
% |
|
1.34 |
% |
|
1.29 |
% |
| Retail |
|
1.20 |
% |
|
1.07 |
% |
|
1.13 |
% |
|
1.10 |
% |
|
1.55 |
% |
|
|
|
|
|
|
|
|
|
|
|
| Total non-owner occupied commercial loans to gross loans |
|
32.75 |
% |
|
32.63 |
% |
|
33.24 |
% |
|
32.21 |
% |
|
32.14 |
% |
|
|
|
|
|
|
|
|
|
|
|
Asset quality
The following table summarizes our current, past due, and nonaccrual loans as of:
|
|
3/31/2023 |
|
12/31/2022 |
|
9/30/2022 |
|
6/30/2022 |
|
3/31/2022 |
| Accruing interest |
|
|
|
|
|
|
|
|
|
|
| Current |
|
$ |
1,449,266 |
|
$ |
1,428,691 |
|
$ |
1,346,141 |
|
$ |
1,228,082 |
|
$ |
1,132,961 |
| Past due 30-89 days |
|
|
5,185 |
|
|
5,182 |
|
|
3,131 |
|
|
2,802 |
|
|
4,099 |
| Past due 90 days or more |
|
|
144 |
|
|
— |
|
|
71 |
|
|
525 |
|
|
284 |
| Total accruing interest |
|
|
1,454,595 |
|
|
1,433,873 |
|
|
1,349,343 |
|
|
1,231,409 |
|
|
1,137,344 |
| Nonaccrual |
|
|
2,578 |
|
|
2,293 |
|
|
1,508 |
|
|
1,483 |
|
|
2,007 |
| Total loans |
|
$ |
1,457,173 |
|
$ |
1,436,166 |
|
$ |
1,350,851 |
|
$ |
1,232,892 |
|
$ |
1,139,351 |
| Total loans past due and in nonaccrual status |
|
$ |
7,907 |
|
$ |
7,475 |
|
$ |
4,710 |
|
$ |
4,810 |
|
$ |
6,390 |
|
|
|
|
|
|
|
|
|
|
|
The following table summarizes the our nonperforming assets as of:
|
|
3/31/2023 |
|
12/31/2022 |
|
9/30/2022 |
|
6/30/2022 |
|
3/31/2022 |
| Nonaccrual loans |
|
$ |
2,578 |
|
$ |
2,293 |
|
$ |
1,508 |
|
$ |
1,483 |
|
$ |
2,007 |
| Accruing loans past due 90 days or more |
|
|
144 |
|
|
— |
|
|
71 |
|
|
525 |
|
|
284 |
| Total nonperforming loans |
|
|
2,722 |
|
|
2,293 |
|
|
1,579 |
|
|
2,008 |
|
|
2,291 |
| Other real estate owned |
|
|
293 |
|
|
293 |
|
|
293 |
|
|
383 |
|
|
383 |
| Total nonperforming assets |
|
$ |
3,015 |
|
$ |
2,586 |
|
$ |
1,872 |
|
$ |
2,391 |
|
$ |
2,674 |
|
|
|
|
|
|
|
|
|
|
|
The following table summarizes our charge-offs, recoveries, provision for loan losses and ALLL as of, and for the three-month periods ended:
|
|
3/31/2023 |
|
12/31/2022 |
|
9/30/2022 |
|
6/30/2022 |
|
3/31/2022 |
| Total charge-offs |
|
$ |
28 |
|
$ |
58 |
|
$ |
40 |
|
$ |
533 |
|
$ |
9 |
| Total recoveries |
|
|
12 |
|
|
11 |
|
|
9 |
|
|
8 |
|
|
7 |
| Net charge-offs (recoveries) |
|
$ |
16 |
|
$ |
47 |
|
$ |
31 |
|
$ |
525 |
|
$ |
2 |
| Provision for loan losses |
|
$ |
236 |
|
$ |
847 |
|
$ |
1,231 |
|
$ |
525 |
|
$ |
502 |
|
|
|
|
|
|
|
|
|
|
|
The following table summarizes the our primary asset quality measures as of:
|
|
3/31/2023 |
|
12/31/2022 |
|
9/30/2022 |
|
6/30/2022 |
|
3/31/2022 |
| Nonperforming loans to gross loans |
|
0.19 |
% |
|
0.16 |
% |
|
0.12 |
% |
|
0.16 |
% |
|
0.20 |
% |
| Nonperforming assets to total assets |
|
0.17 |
% |
|
0.15 |
% |
|
0.12 |
% |
|
0.16 |
% |
|
0.19 |
% |
| Allowance for credit losses to gross loans |
|
1.04 |
% |
|
0.91 |
% |
|
0.90 |
% |
|
0.89 |
% |
|
0.97 |
% |
| Allowance for credit losses to gross loans, net of PPP loans |
|
1.04 |
% |
|
0.91 |
% |
|
0.90 |
% |
|
0.89 |
% |
|
0.97 |
% |
| Net charge-offs (recoveries) to QTD average gross loans |
|
— |
% |
|
— |
% |
|
— |
% |
|
0.04 |
% |
|
— |
% |
| Provision for loan losses to QTD average gross loans |
|
0.02 |
% |
|
0.06 |
% |
|
0.10 |
% |
|
0.04 |
% |
|
0.05 |
% |
|
|
|
|
|
|
|
|
|
|
|
The following table summarizes our net unamortized discounts on purchased loans as of:
|
|
3/31/2023 |
|
12/31/2022 |
|
9/30/2022 |
|
6/30/2022 |
|
3/31/2022 |
| Net unamortized premium (discount) on purchased loans |
|
$ |
— |
|
$ |
— |
|
$ |
(25 |
) |
|
$ |
(51 |
) |
|
$ |
(76 |
) |
|
|
|
|
|
|
|
|
|
|
|
|
|
|
|
|
|
|
|
The following table summarizes the average loan size as of:
|
|
3/31/2023 |
|
12/31/2022 |
|
9/30/2022 |
|
6/30/2022 |
|
3/31/2022 |
| Commercial and industrial |
|
$ |
312 |
|
$ |
311 |
|
$ |
314 |
|
$ |
309 |
|
$ |
264 |
| Commercial real estate |
|
|
895 |
|
|
890 |
|
|
851 |
|
|
802 |
|
|
756 |
| Total commercial loans |
|
|
739 |
|
|
740 |
|
|
711 |
|
|
667 |
|
|
618 |
| Residential mortgage |
|
|
228 |
|
|
225 |
|
|
217 |
|
|
208 |
|
|
193 |
| Home equity |
|
|
52 |
|
|
52 |
|
|
52 |
|
|
50 |
|
|
46 |
| Total residential real estate loans |
|
|
170 |
|
|
166 |
|
|
159 |
|
|
151 |
|
|
140 |
| Consumer |
|
|
13 |
|
|
13 |
|
|
14 |
|
|
14 |
|
|
14 |
| Gross loans |
|
$ |
328 |
|
$ |
323 |
|
$ |
311 |
|
$ |
292 |
|
$ |
271 |
|
|
|
|
|
|
|
|
|
|
|
All other assets
The following tables outline the composition and changes in other assets as of:
|
|
3/31/2023 |
|
12/31/2022 |
|
9/30/2022 |
|
6/30/2022 |
|
3/31/2022 |
| Premises and equipment, net |
|
$ |
15,219 |
|
|
$ |
15,571 |
|
|
$ |
16,100 |
|
$ |
16,459 |
|
|
$ |
16,696 |
|
| Federal Home Loan Bank stock |
|
|
10,958 |
|
|
|
10,215 |
|
|
|
5,760 |
|
|
4,140 |
|
|
|
3,337 |
|
| Corporate owned life insurance |
|
|
26,869 |
|
|
|
26,697 |
|
|
|
26,522 |
|
|
26,350 |
|
|
|
26,136 |
|
| Mortgage servicing rights |
|
|
8,773 |
|
|
|
8,666 |
|
|
|
8,795 |
|
|
8,588 |
|
|
|
8,155 |
|
| Accrued interest receivable |
|
|
3,976 |
|
|
|
4,002 |
|
|
|
3,300 |
|
|
2,798 |
|
|
|
2,784 |
|
| Goodwill |
|
|
8,853 |
|
|
|
8,853 |
|
|
|
8,853 |
|
|
8,853 |
|
|
|
8,853 |
|
| Other assets |
|
|
|
|
|
|
|
|
|
|
| Core deposit intangibles |
|
|
760 |
|
|
|
836 |
|
|
|
943 |
|
|
1,051 |
|
|
|
1,158 |
|
| Right-of-use assets |
|
|
1,107 |
|
|
|
1,204 |
|
|
|
1,065 |
|
|
1,159 |
|
|
|
1,110 |
|
| Other real estate owned |
|
|
293 |
|
|
|
293 |
|
|
|
293 |
|
|
383 |
|
|
|
383 |
|
| Other |
|
|
5,946 |
|
|
|
5,974 |
|
|
|
5,017 |
|
|
3,882 |
|
|
|
3,772 |
|
| Total |
|
|
8,106 |
|
|
|
8,307 |
|
|
|
7,318 |
|
|
6,475 |
|
|
|
6,423 |
|
| All other assets |
|
$ |
82,754 |
|
|
$ |
82,311 |
|
|
$ |
76,648 |
|
$ |
73,663 |
|
|
$ |
72,384 |
|
|
|
|
|
|
|
|
|
|
|
|
|
|
3/31/2023 vs 12/31/2022 |
|
|
|
3/31/2023 vs 3/31/2022 |
|
|
Variance |
|
|
|
Variance |
|
|
Amount |
|
% |
|
|
|
Amount |
|
% |
| Premises and equipment, net |
|
$ |
(352 |
) |
|
(2.26 |
)% |
|
|
|
$ |
(1,477 |
) |
|
(8.85 |
)% |
| Federal Home Loan Bank stock |
|
|
743 |
|
|
|
7.27 |
% |
|
|
|
|
7,621 |
|
|
|
228.38 |
% |
| Corporate owned life insurance |
|
|
172 |
|
|
|
0.64 |
% |
|
|
|
|
733 |
|
|
|
2.80 |
% |
| Mortgage servicing rights |
|
|
107 |
|
|
|
1.23 |
% |
|
|
|
|
618 |
|
|
|
7.58 |
% |
| Accrued interest receivable |
|
|
(26 |
) |
|
(0.65 |
)% |
|
|
|
|
1,192 |
|
|
|
42.82 |
% |
| Goodwill |
|
|
— |
|
|
|
— |
% |
|
|
|
|
— |
|
|
|
— |
% |
| Other assets |
|
|
|
|
|
|
|
|
|
|
| Core deposit intangibles |
|
|
(76 |
) |
|
(9.09 |
)% |
|
|
|
|
(398 |
) |
|
(34.37 |
)% |
| Right-of-use assets |
|
|
(97 |
) |
|
(8.06 |
)% |
|
|
|
|
(3 |
) |
|
(0.27 |
)% |
| Other real estate owned |
|
|
— |
|
|
|
— |
% |
|
|
|
|
(90 |
) |
|
(23.50 |
)% |
| Other |
|
|
(28 |
) |
|
(0.47 |
)% |
|
|
|
|
2,174 |
|
|
|
57.64 |
% |
| Total |
|
|
(201 |
) |
|
(2.42 |
)% |
|
|
|
|
1,683 |
|
|
|
26.20 |
% |
| All other assets |
|
$ |
443 |
|
|
|
0.54 |
% |
|
|
|
$ |
10,370 |
|
|
|
14.33 |
% |
|
|
|
|
|
|
|
|
|
|
|
The increase in FHLB stock throughout 2022 and into the first quarter 2023 is a direct result of an increase in FHLB advances as a result of our robust loan growth.
Total deposits
The following tables outline the composition and changes in the deposit portfolio as of:
|
|
3/31/2023 |
|
12/31/2022 |
|
9/30/2022 |
|
6/30/2022 |
|
3/31/2022 |
| Noninterest bearing demand |
|
$ |
457,585 |
|
|
$ |
461,390 |
|
|
$ |
500,204 |
|
$ |
493,262 |
|
|
$ |
480,230 |
|
| Interest bearing |
|
|
|
|
|
|
|
|
|
|
| Savings |
|
|
323,254 |
|
|
|
351,066 |
|
|
|
380,118 |
|
|
368,849 |
|
|
|
377,170 |
|
| Money market demand |
|
|
214,781 |
|
|
|
170,459 |
|
|
|
213,672 |
|
|
144,606 |
|
|
|
135,051 |
|
| NOW |
|
|
|
|
|
|
|
|
|
|
| Retail NOW |
|
|
155,659 |
|
|
|
136,611 |
|
|
|
148,775 |
|
|
118,707 |
|
|
|
126,461 |
|
| Brokered NOW |
|
|
60,005 |
|
|
|
40,009 |
|
|
|
— |
|
|
— |
|
|
|
— |
|
| Total NOW Accounts |
|
|
215,664 |
|
|
|
176,620 |
|
|
|
148,775 |
|
|
118,707 |
|
|
|
126,461 |
|
| Time deposits |
|
|
|
|
|
|
|
|
|
|
| Other time deposits |
|
|
121,567 |
|
|
|
102,358 |
|
|
|
80,454 |
|
|
84,376 |
|
|
|
112,237 |
|
| Brokered time deposits |
|
|
20,077 |
|
|
|
70,000 |
|
|
|
20,000 |
|
|
20,000 |
|
|
|
20,000 |
|
| Internet time deposits |
|
|
990 |
|
|
|
990 |
|
|
|
1,986 |
|
|
1,743 |
|
|
|
1,743 |
|
| Total time deposits |
|
|
142,634 |
|
|
|
173,348 |
|
|
|
102,440 |
|
|
106,119 |
|
|
|
133,980 |
|
| Total deposits |
|
$ |
1,353,918 |
|
|
$ |
1,332,883 |
|
|
$ |
1,345,209 |
|
$ |
1,231,543 |
|
|
$ |
1,252,892 |
|
|
|
|
|
|
|
|
|
|
|
|
|
|
3/31/2023 vs 12/31/2022 |
|
|
|
3/31/2023 vs 3/31/2022 |
|
|
Variance |
|
|
|
Variance |
|
|
Amount |
|
% |
|
|
|
Amount |
|
% |
| Noninterest bearing demand |
|
$ |
(3,805 |
) |
|
(0.82 |
)% |
|
|
|
$ |
(22,645 |
) |
|
(4.72 |
)% |
| Interest bearing |
|
|
|
|
|
|
|
|
|
|
| Savings |
|
|
(27,812 |
) |
|
(7.92 |
)% |
|
|
|
|
(53,916 |
) |
|
(14.29 |
)% |
| Money market demand |
|
|
44,322 |
|
|
|
26.00 |
% |
|
|
|
|
79,730 |
|
|
|
59.04 |
% |
| NOW |
|
|
|
|
|
|
|
|
|
|
| Retail NOW |
|
|
19,048 |
|
|
|
13.94 |
% |
|
|
|
|
29,198 |
|
|
|
23.09 |
% |
| Brokered NOW |
|
|
19,996 |
|
|
|
49.98 |
% |
|
|
|
|
60,005 |
|
|
|
— |
% |
| Total NOW Accounts |
|
|
39,044 |
|
|
|
22.11 |
% |
|
|
|
|
89,203 |
|
|
|
70.54 |
% |
| Time deposits |
|
|
|
|
|
|
|
|
|
|
| Other time deposits |
|
|
19,209 |
|
|
|
18.77 |
% |
|
|
|
|
9,330 |
|
|
|
8.31 |
% |
| Brokered time deposits |
|
|
(49,923 |
) |
|
(71.32 |
)% |
|
|
|
|
77 |
|
|
|
0.39 |
% |
| Internet time deposits |
|
|
— |
|
|
|
— |
% |
|
|
|
|
(753 |
) |
|
(43.20 |
)% |
| Total time deposits |
|
|
(30,714 |
) |
|
(17.72 |
)% |
|
|
|
|
8,654 |
|
|
|
6.46 |
% |
| Total deposits |
|
$ |
21,035 |
|
|
|
1.58 |
% |
|
|
|
$ |
101,026 |
|
|
|
8.06 |
% |
|
|
|
|
|
|
|
|
|
|
|
Beginning in March 2022, the FOMC began raising its target federal funds rate in order to combat rising inflation. Since then, the FOMC has raised its target federal funds rate nine times, from a target range of 0.00-0.25% to 4.75-5.00%, or 475 basis points. This rapid increase in interest rates has led to significant competition amongst financial institutions. Due to the expectation that interest rates may continue to rise, customers have been unwilling to lock in long-term funds, leading to a shift in demand to higher-yielding non-maturity deposit accounts. While overall market liquidity continues to tighten and be extremely competitive, we have strategic initiatives in place to grow core market deposits in 2023.
Total borrowed funds
The following tables outline the composition and changes in borrowed funds as of:
|
|
3/31/2023 |
|
12/31/2022 |
|
9/30/2022 |
|
6/30/2022 |
|
3/31/2022 |
| Federal Home Loan Bank borrowings |
|
$ |
238,500 |
|
$ |
202,000 |
|
|
$ |
97,000 |
|
$ |
92,000 |
|
$ |
35,000 |
|
| Subordinated debentures |
|
|
14,000 |
|
|
14,000 |
|
|
|
14,000 |
|
|
14,000 |
|
|
14,000 |
|
| Other borrowings |
|
|
6,550 |
|
|
6,350 |
|
|
|
5,600 |
|
|
5,000 |
|
|
3,000 |
|
| Total borrowed funds |
|
$ |
259,050 |
|
$ |
222,350 |
|
|
$ |
116,600 |
|
$ |
111,000 |
|
$ |
52,000 |
|
|
|
|
|
|
|
|
|
|
|
|
|
|
3/31/2023 vs 12/31/2022 |
|
|
|
3/31/2023 vs 3/31/2022 |
|
|
Variance |
|
|
|
Variance |
|
|
Amount |
|
% |
|
|
|
Amount |
|
% |
| Federal Home Loan Bank borrowings |
|
$ |
36,500 |
|
|
18.07 |
% |
|
|
|
$ |
203,500 |
|
|
581.43 |
% |
| Subordinated debentures |
|
|
— |
|
|
— |
% |
|
|
|
|
— |
|
|
— |
% |
| Other borrowings |
|
|
200 |
|
|
3.15 |
% |
|
|
|
|
3,550 |
|
|
118.33 |
% |
| Total borrowed funds |
|
$ |
36,700 |
|
|
16.51 |
% |
|
|
|
$ |
207,050 |
|
|
398.17 |
% |
|
|
|
|
|
|
|
|
|
|
|
We utilize a mix of borrowed funds and organic deposit growth to fund loan demand. The increase in Federal Home Loan Bank borrowings throughout 2022 and into 2023 was the result of the highly competitive deposit landscape and the growth of our loan portfolio, which grew $318,405, or 27.96%, net of PPP loans, since the first quarter of 2022 (see “Wholesale funding sources”below).
Wholesale funding sources
Although we have been successful at growing market deposits, we utilize wholesale funding sources when necessary to fill gaps when asset growth outpaces deposit growth. Our wholesale funding sources include Federal Home Loan Bank borrowings, correspondent Fed Funds lines and brokered deposits. Although wholesale funding sources are typically more expensive than core deposits, they are an integral part of our funding.
The following tables outline the composition and changes in wholesale funding sources as of:
|
|
3/31/2023 |
|
12/31/2022 |
|
9/30/2022 |
|
6/30/2022 |
|
3/31/2022 |
| Federal Home Loan Bank borrowings |
|
$ |
238,500 |
|
|
$ |
202,000 |
|
|
$ |
97,000 |
|
$ |
92,000 |
|
|
$ |
35,000 |
|
| Subordinated debentures |
|
|
14,000 |
|
|
|
14,000 |
|
|
|
14,000 |
|
|
14,000 |
|
|
|
14,000 |
|
| Other borrowings |
|
|
6,550 |
|
|
|
6,350 |
|
|
|
5,600 |
|
|
5,000 |
|
|
|
3,000 |
|
| Brokered NOW accounts |
|
|
60,005 |
|
|
|
40,009 |
|
|
|
— |
|
|
— |
|
|
|
— |
|
| Brokered time deposits |
|
|
20,077 |
|
|
|
70,000 |
|
|
|
20,000 |
|
|
20,000 |
|
|
|
20,000 |
|
| Internet time deposits |
|
|
990 |
|
|
|
990 |
|
|
|
1,986 |
|
|
1,743 |
|
|
|
1,743 |
|
| Total wholesale funds |
|
$ |
340,122 |
|
|
$ |
333,349 |
|
|
$ |
138,586 |
|
$ |
132,743 |
|
|
$ |
73,743 |
|
|
|
|
|
|
|
|
|
|
|
|
|
|
3/31/2023 vs 12/31/2022 |
|
|
|
3/31/2023 vs 3/31/2022 |
|
|
Variance |
|
|
|
Variance |
|
|
Amount |
|
% |
|
|
|
Amount |
|
% |
| Federal Home Loan Bank borrowings |
|
$ |
36,500 |
|
|
|
18.07 |
% |
|
|
|
|
203,500 |
|
|
|
581.43 |
% |
| Subordinated debentures |
|
|
— |
|
|
|
— |
% |
|
|
|
|
— |
|
|
|
— |
% |
| Other borrowings |
|
|
200 |
|
|
|
3.15 |
% |
|
|
|
|
3,550 |
|
|
|
118.33 |
% |
| Brokered NOW accounts |
|
|
19,996 |
|
|
|
49.98 |
% |
|
|
|
|
60,005 |
|
|
N/A |
| Brokered time deposits |
|
|
(49,923 |
) |
|
(71.32 |
)% |
|
|
|
|
77 |
|
|
|
0.39 |
% |
| Internet time deposits |
|
|
— |
|
|
|
— |
% |
|
|
|
|
(753 |
) |
|
(43.20 |
)% |
| Total wholesale funds |
|
$ |
6,773 |
|
|
|
2.03 |
% |
|
|
|
$ |
266,379 |
|
|
|
361.23 |
% |
|
|
|
|
|
|
|
|
|
|
|
As noted above, the increased competition for deposits, coupled with strong loan growth has led to an increased utilization of wholesale funding sources. During the first quarter of 2023, we had a $50,000 brokered time deposit mature. We replaced this with additional FHLB borrowings as well as non-maturity brokered deposits.
Accrued interest payable and other liabilities
Accrued interest payable and other liabilities includes accrued interest payable, federal income taxes payable, deferred federal income taxes payable, and all other liabilities (none of which are individually significant).
Total shareholders’ equity
We are considered a “well-capitalized” institution, as our capital ratios exceed the minimum designated standards necessary in accordance with Basel III guidelines. As of March 31, 2023, the Bank’s total capital ratio was 11.27%, tier 1 capital ratio was 10.20%, and tier 1 leverage ratio was 8.62%. The minimum requirements to be considered well-capitalized are a total capital ratio of 10.00%, tier 1 capital ratio of 8.00%, and tier 1 leverage ratio of 5.00%. While we continue to be considered well-capitalized, we are focused on enhancing our capital ratios through asset growth moderation strategies.
The following tables outline the composition and changes in shareholders’ equity as of:
|
|
3/31/2023 |
|
12/31/2022 |
|
9/30/2022 |
|
6/30/2022 |
|
3/31/2022 |
| Common stock |
|
$ |
73,868 |
|
|
$ |
73,569 |
|
|
$ |
73,460 |
|
|
$ |
73,324 |
|
|
$ |
74,132 |
|
| Retained earnings |
|
|
64,863 |
|
|
|
63,044 |
|
|
|
59,080 |
|
|
|
55,469 |
|
|
|
52,393 |
|
| Accumulated other comprehensive (loss) income |
|
|
(10,484 |
) |
|
|
(10,526 |
) |
|
|
(10,910 |
) |
|
|
(10,227 |
) |
|
|
(5,179 |
) |
| Total shareholders’ equity |
|
$ |
128,247 |
|
|
$ |
126,087 |
|
|
$ |
121,630 |
|
|
$ |
118,566 |
|
|
$ |
121,346 |
|
|
|
|
|
|
|
|
|
|
|
|
|
|
3/31/2023 vs 12/31/2022 |
|
|
|
3/31/2023 vs 3/31/2022 |
|
|
Variance |
|
|
|
Variance |
|
|
Amount |
|
% |
|
|
|
Amount |
|
% |
| Common stock |
|
$ |
299 |
|
|
|
0.41 |
% |
|
|
|
$ |
(264 |
) |
|
(0.36 |
)% |
| Retained earnings |
|
|
1,819 |
|
|
|
2.89 |
% |
|
|
|
|
12,470 |
|
|
|
23.80 |
% |
| Accumulated other comprehensive (loss) income |
|
|
42 |
|
|
(0.40 |
)% |
|
|
|
|
(5,305 |
) |
|
|
102.43 |
% |
| Total shareholders’ equity |
|
$ |
2,160 |
|
|
|
1.71 |
% |
|
|
|
$ |
6,901 |
|
|
|
5.69 |
% |
|
|
|
|
|
|
|
|
|
|
|
The Board of Directors has authorized the repurchase up to $10,000 of common stock. As of March 31, 2023, we had $1,393 of common stock available to repurchase through the program. The following tables outline the number of shares, dollar amount and weighted average share price associated with the common stock repurchase plan for the following periods:
|
|
Three Months Ended |
|
|
3/31/2023 |
|
12/31/2022 |
|
9/30/2022 |
|
6/30/2022 |
|
3/31/2022 |
| Number of Shares Repurchased |
|
|
— |
|
|
— |
|
|
— |
|
|
35,000 |
|
|
51,461 |
| Dollar Amount of Shares Repurchased |
|
$ |
— |
|
$ |
— |
|
$ |
— |
|
$ |
935 |
|
$ |
1,501 |
| Weighted Average Share Price |
|
N/A |
|
N/A |
|
N/A |
|
$ |
26.71 |
|
$ |
29.17 |
|
|
|
|
|
|
|
|
|
|
|
|
|
Stock Performance
The following graph compares the cumulative total shareholder return on our common stock for the last five years with the cumulative total return on the ABA NASDAQ Community Bank Index (NASDAQ: ABAQ) over the same period. The graph assumes the value of an investment in our common stock and the ABA NASDAQ Community Bank Index was $100 at March 31, 2018 and all dividends were reinvested.
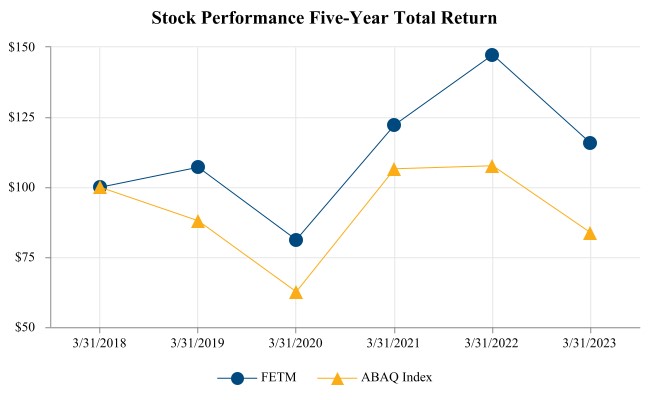
The graph accompanying this announcement is available at https://www.globenewswire.com/NewsRoom/AttachmentNg/ce2e9192-3d63-43cb-b7f3-ae7bc5a1176d
| Date |
|
FETM |
|
ABAQ Index |
| 3/31/2018 |
|
$ |
100.00 |
|
$ |
100.00 |
| 3/31/2019 |
|
|
107.04 |
|
|
87.93 |
| 3/31/2020 |
|
|
81.22 |
|
|
62.64 |
| 3/31/2021 |
|
|
122.23 |
|
|
106.53 |
| 3/31/2022 |
|
|
147.19 |
|
|
107.58 |
| 3/31/2023 |
|
|
115.70 |
|
|
83.59 |
|
|
|
|
|
|
|
Abbreviations and Acronyms
| ABA: American Bankers Association |
FTE: Fully taxable equivalent |
| ACH: Automated Clearing House |
GAAP: Generally Accepted Accounting Principles |
| ACL: Allowance for credit losses |
HFS: Held-for-sale |
| AFS: Available-for-sale |
HTM: Held-to-maturity |
| AIR: Accrued interest receivable |
HFS: Held-for-sale |
| AOCI: Accumulated other comprehensive income |
HTM: Held-to-maturity |
| ARRC: Alternative Reference Rates Committee |
IRA: Individual retirement account |
| ASC: Accounting Standards Codification |
ITM: Interactive Teller Machine |
| ASU: Accounting Standards Update |
LIBOR: London Interbank Offered Rate |
| ATM: Automated teller machine |
MSR: Mortgage servicing rights |
| CARES Act: Coronavirus Aid, Relief, and Economic Security Act |
N/M: Not meaningful |
| CDI: Core deposit intangible |
NASDAQ: National Association of Securities Dealers Automated Quotations |
| CET1: Common equity tier 1 |
NOW: Negotiable order of withdrawal |
| COLI: Corporate owned life insurance |
NSF: Non-sufficient funds |
| COVID-19: Coronavirus Disease 2019 |
OCI: Other comprehensive income |
| DRIP: Dividend Reinvestment Plan |
OIS: Overnight Index Swap |
| EPS: Earnings Per Common Share |
OREO: Other real estate owned |
| ESOP: Employee Stock Ownership Plan |
OTTI: Other-than-temporary impairment |
| FASB: Financial Accounting Standards Board |
PPP: Paycheck Protection Program |
| FDIC: Federal Deposit Insurance Corporation |
PPPLF: Paycheck Protection Program Liquidity Facility |
| FHLB: Federal Home Loan Bank |
QTD: Quarter-to-date |
| FHLLC: Fentura Holdings LLC |
SAB: Staff Accounting Bulletin |
| FHLMC: Federal Home Loan Mortgage Corporation |
SBA: U.S. Small Business Administration |
| FNMA: Federal National Mortgage Association |
SEC: Securities and Exchange Commission |
| FOMC: Federal Open Market Committee |
SERP: Supplemental Executive Retirement Plan |
| FRB: Federal Reserve Bank |
SOFR: Secured Overnight Funding Rate |
| FSB: Farmers State Bank of Munith |
TDR: Troubled debt restructuring |
|
|
About Fentura Financial, Inc. and The State Bank
Fentura Financial, Inc. is the holding company for The State Bank. It was formed in 1987 and is traded on the OTCQX exchange under the symbol FETM, and has been recognized as one of the Top 50 performing stocks on that exchange.
The State Bank is a full-service, 5-Star Bauer Financial rated commercial, retail and trust bank headquartered in Fenton, Michigan. It currently operates 20 offices in Bay, Genesee, Ingham, Jackson, Livingston, Oakland, Saginaw, and Shiawassee counties. The State Bank believes in the potential of banking to help create better lives, better businesses, and better communities, and works to achieve this through its full array of consumer, mortgage, SBA, commercial and wealth management banking and advisory services, together with philanthropic and volunteer support to organizations and groups within the communities it serves. More information can be found at www.thestatebank.com or www.fentura.com.
Cautionary Statement: This press release contains certain forward-looking statements that involve risks and uncertainties. Forward-looking statements include, but are not limited to, statements concerning future growth in earning assets and net income. Such statements are subject to certain risks and uncertainties which could cause actual results to differ materially from those expressed or implied by such forward-looking statements, including, but not limited to, economic, competitive, governmental and technological factors affecting the Company’s operations, markets, products, services, interest rates and fees for services. Readers are cautioned not to place undue reliance on these forward-looking statements, which speak only as of the date of this press release.
| Contacts: |
Ronald L. Justice |
Aaron D. Wirsing |
|
President & CEO |
Chief Financial Officer |
|
Fentura Financial, Inc. |
Fentura Financial, Inc. |
|
810.714.3902 |
810.714.3925 |
|
ron.justice@thestatebank.com |
aaron.wirsing@thestatebank.com |