As commodity prices fell at the end of 2014 and in early 2015, companies that participate in the Bakken shale in North Dakota and Montana were hit the hardest amongst U.S. unconventional operators. The WTI oil benchmark price dropped to below $50 in the first quarter of 2015 and the Bakken companies suffered the biggest drops in netbacks on average than any other major play or producing area. A brief respite was experienced as WTI prices rebounded to an average closer to $60 in Q2, but as of August 25, 2015, the Q3 average WTI price had fallen again, sitting below even the Q1 average. Using Evaluate Energy data from the past 12 months, we can see that Q3 netbacks for Bakken operators should therefore be low again, despite widespread improvements in operational costs per barrel of oil produced.
Average WTI Prices per Quarter

Bakken Netbacks Tumble in Q1 2015
In a study of 80 U.S. based companies’ pre-hedging operating netbacks (see note 1) for the periods Q3 2014 and Q1 2015, the data shows that the companies in the Bakken suffered the most with the fall in commodity prices.
Twelve of the 80 companies have at least a significant portion of their upstream operations located in the Bakken area – Abraxas Petroleum Corp. (NASDAQ: AXAS, Forum), Continental Resources Inc. (NYSE: CLR, Forum), Emerald Oil Inc. (AMX: EOX, Forum), Halcón Resources Corp. (NYSE: HK, Forum), Hess Corp. (NYSE: HES, Forum), Linn Energy LLC (NASDAQ: LINE, Forum), MDU Resources Group Inc. (NYSE: MDU, Forum), Northern Oil & Gas Inc. (AMX: NOG, Forum), Oasis Petroleum Inc. (NYSE: OAS, Forum), QEP Resources Inc. (NYSE: QEP, Forum), Triangle Petroleum Corp. (AMX: TPLM, Forum) and Whiting Petroleum Corp. (NYSE: WLL, Forum).
These companies’ percentage drops in operating netback between Q3 2014 and Q1 2015 has been plotted on the following chart with the percentage drop experienced by every other company in the group of 80, which includes international and multinational operators, Eagle Ford operators, Marcellus operators and Permian Basin operators (see note 2).
Download Supplemental Data Booklet for this article.
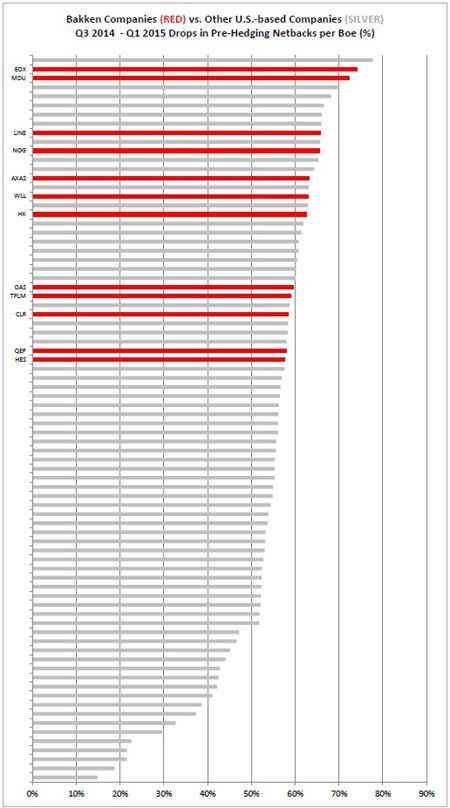
Source: Evaluate Energy – For a larger image, download the Supplemental Data Booklet for this article here
Every one of the 80 companies saw its operating netback fall between Q3 2014 and Q1 2015, but on average it is the companies in the Bakken that saw the biggest fall. This was probably to be expected due to the focus on oil production in the Bakken versus output of gas (Marcellus) or gas liquids (Eagle Ford) in some of the other play areas. A dramatic drop in oil price was always going to impact Bakken operators to a greater extent than some of their peers. However, the effect of the falling prices on Bakken operators does still stand out. For more on falling netbacks between Q3 2014 and Q1 2015, download the supplemental data booklet for this article.
Some Respite in Q2
As WTI rebounded somewhat towards an average of almost $60 in the second quarter of 2015, the Bakken companies saw their netbacks rebound in turn.

Source: Evaluate Energy – MDU and TPLM are not included (see note 3).
Whilst Q2 must have been encouraging for the companies in question, there is a definite pattern here and this will be concerning heading into Q3. Of course, in terms of the actual prices and netbacks achieved, some companies have done better than others, but wide swings in oil prices seem to have affected the Bakken companies’ netbacks as one, not as individual entities, over the past 12 months. So it is reasonable to assume that Q3’s decline in WTI to another quarterly average of under $50 is likely to continue this pattern and significantly impact all Bakken-focused companies in a negative manner.
Costs Being Brought Under Control
On the whole, however, it looks as if the Bakken companies are in a better place to deal with falling prices in Q3 than they were in Q1. The Bakken company netbacks are looking like they will not fall to Q1 levels if the WTI price for the whole of Q3 ends up averaging at the same price as Q1 ($48.57). This is due to operating expenses per barrel being lower – on average – across the group in Q2 2015 than the previous three quarters, particularly Q1.

Source: Evaluate Energy – MDU and TPLM are not included again (see note 3)
Only Abraxas (due to lower production) and Emerald Oil (due to issues with maintenance, water disposal and regulatory expense increases) saw an increase in their operating expenses per barrel, whilst the other Bakken companies all reduced their expenses per barrel compared with Q1.
So whilst Q3 is looking like another gloomy period for company netbacks in the Bakken with a resumption in lower commodity prices, it is likely not to be as bad as Q1 – but only if each company can continue to keep its operating expenses under control as we have seen in Q2.
All data here is taken from the Evaluate Energy database, which provides Evaluate Energy subscribers with over 25 years' coverage of the world's biggest and most significant oil and gas companies. Evaluate Energy also has a mergers & acquisitions database, covering all E&P asset, corporate and farm-in deals back to 2008, as well as refinery, LNG, midstream and oil service sector deals. For more on Evaluate Energy and its products, please download our brochure.
Download our Brochure
Notes:
1) Pre-hedging operating netback is calculated by taking each company’s E&P revenue, E&P operating costs and transportation expenses and bringing them to a per boe produced level. This calculation excludes any realised hedging gains.
2) The group of 80 companies included in the Q3 2014 – Q1 2015 report is available in the supplemental data booklet to this article – click here to download.
3) MDU has started to treats its upstream segment as discontinued operations as it attempts to sell its E&P subsidiary Fidelity Exploration & Production and does not report E&P figures anymore, whilst TPLM has not yet reported (as of time of writing) its results for the second quarter because the company’s year end is January, rather than December; the company’s Q2 results are due to be released in the second week of September.