Past behavior is all we have when evaluating the most probable future of the gold market. In this piece, we look at the long-term technical picture and the driving forces that currencies exert on the gold price.
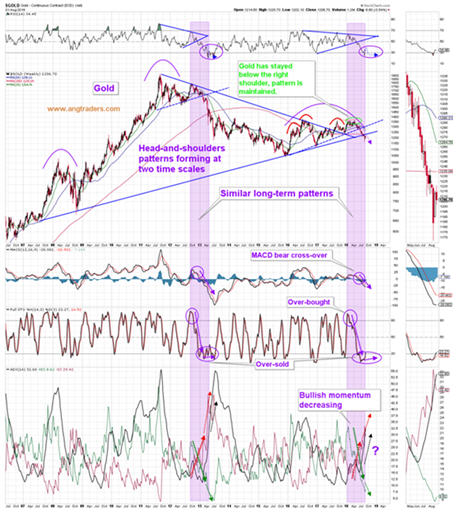
In the very-long-term, gold is completing the right-shoulder of a large bearish head-and-shoulders pattern which started in 2007. In addition, it continues to replicate the bearish pattern from 2013 (shaded areas on chart) which knocked 30% off of the gold price. A similar drop at this point would send gold to the $900 mark. Bounces aside, gold is likely to experience further pressure (chart below).
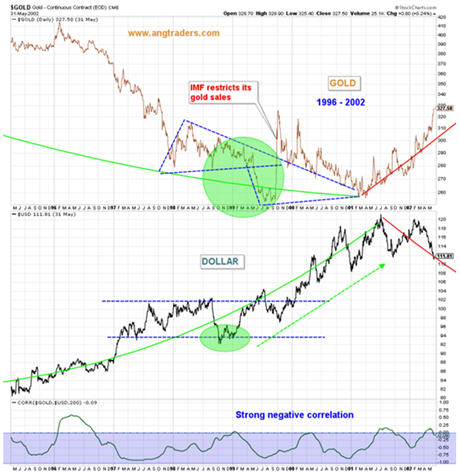
Gold continues to be driven by currencies, especially the dollar. Long-term, gold and the dollar are trading in similar fashion to 2000 (chart below).

The dollar and gold are replicating their respective price patterns from 2000. The dollar is rising out of a trading-range, just like it did in 2000, and this rise is likely to continue as long as the Fed maintains its tightening schedule, which means gold will remain under pressure. The next two charts show a close-up view of the patterns.

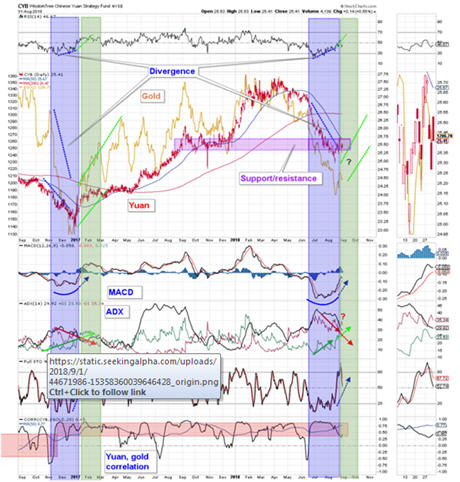
At the end of 2016, the correlation between the Yuan and gold flipped from neutral to positive remaining that way ever since (pink areas on the chart below). The technical pattern from late-2016 is similar to today's (purple areas below). Recently, like 2016, the Yuan has bounced back into what was the support zone, but which now could act as resistance. The Yuan continues to trade within this trading-range and we see the probabilities of the Yuan moving up, down, or sideways as roughly equal which means we can derive no guidance from the Yuan at this time (chart below).
The USD/JPY FOREX pair has a strong negative correlation with gold. The pair looks technically set to resume rallying, which means gold will resume its downward price movement (chart below).
The USD/JPY FOREX pair has a strong negative correlation with gold. The pair looks technically set to resume rallying, which means gold will resume its downward price movement (chart below).

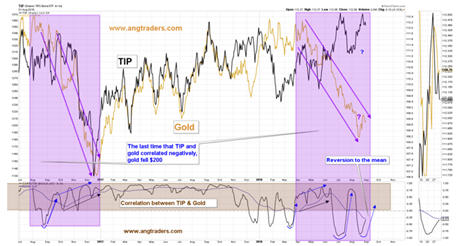
Gold and inflation expectations, as measured by TIP, are no-longer positively correlated like they were throughout most of 2017. In 2016, the correlation also went negative and gold had a $200 drop. It is possible that the present, longer-lasting negative correlation may result in an even greater drop in gold than it experienced in 2016.
This week, the correlation started to revert to the mean with both TIP and gold dropping (chart below). TIP is likely to continue dropping from its recent high, and gold is likely to drop along with it as the correlation reverts to the mean.
The HUI Gold Bugs index, and the Gold Miners Percent Bullish index are both at their respective supports from their down-sloping trend-lines, and gold is at the $1200 resistance/support level. The RSI of the HUI is still in over-sold territory, which means there could still be some upside to the gold miners, but we suspect that will be limited by the down-sloping upper trend-lines.
Gold may stay elevated for a while longer, but its bias continues to be downward (chart below).
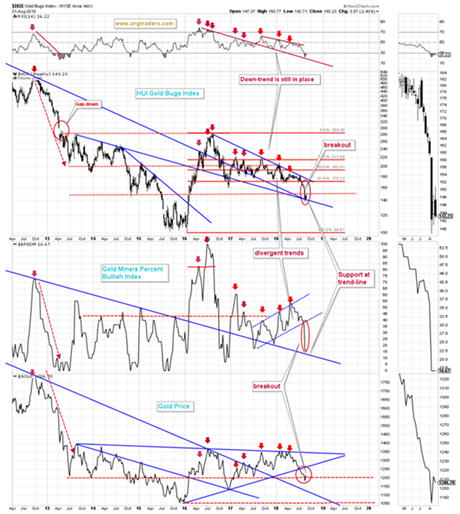 In the near-term, gold could stay trading between $1200 and $1230, but longer-term, the balance of probabilities is to the downside.
ANG Traders
Join us at www.angtraders.com and replicate our trades and profits.